Question
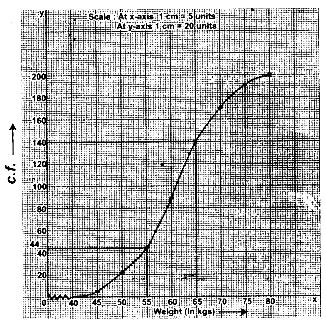
Using a graph paper, drawn an Ogive for the following distribution which shows a record of the weight in kilograms of 200 students.
Use your ogive to estimate the following:
(i) The percentage of students weighing 55kg or more.
(ii) The weight above which the heaviest 30% of the students fall.
(iii) The number of students who are:
(1) under-weight and
(2) over-weight, if 55·70 kg is considered as standard weight.
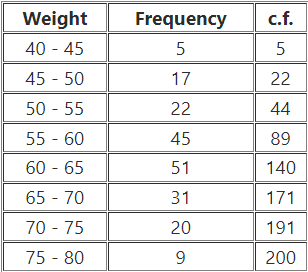
| Weight | Frequency |
| 40 - 45 | 5 |
| 45 - 50 | 17 |
| 50 - 55 | 22 |
| 55 - 60 | 45 |
| 60 - 65 | 51 |
| 65 - 70 | 31 |
| 70 - 75 | 20 |
| 75 - 80 | 9 |
(i) The percentage of students weighing 55kg or more.
(ii) The weight above which the heaviest 30% of the students fall.
(iii) The number of students who are:
(1) under-weight and
(2) over-weight, if 55·70 kg is considered as standard weight.