Question
What are the adverse effects of technology?
(i) Lack of communication among family members and friends which leads to social isolation and depression.
(ii) People spend very less time on physical activities and exercise which leads to obesity.
(iii) We are less interacting face to face in the social community which leads to a lack of social skills.
(iv) Addiction to social networking sites and games leads to poor sleeping habits.
Generate a complete, print-ready paper with questions like this in minutes — across 16+ boards, with answer keys.
![]()
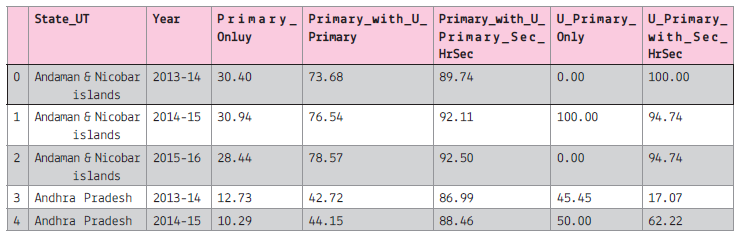
data name : Percentage of Schools with Computers from 2013-14 to 2015-16
Screen shot of the data:
Assuming that we have saved the file with name: "computer_data" in python default folder.
Assuming that all the required libraries are imported once:
![]()
(i) To create the data frame of the above file.
(ii) To display all the column names of the data frame.
(iii) To plot the line graph for the first 5 record of the Primary Only column on y-axis and 'State_UT' on x-axis.
The line colour should be red and marker as 'x'. The graph will display only 2013-14
(iv) To display the histogram of the 2013-14, primary_only column.
(v) To display bar graph of the last 7 record of the year 2013-14 use the title and required label. Also write the statement to create the data frame.
(vi) To display the pie chart of the first 10 records of the 2013-14. Also create the data frame.
(vii) To display the boxplot for the Sec with higher secondary and All India data.
(viii) To display the scatter diagram of the 2014-15
Table: Bank
| AccNo | Cust_name | FD_Amount | Months | Int_Rate | FD_Date |
| 1001 | Arti Gupta | 30000 | 36 | 6.00 | 2018-07-01 |
| 1002 | Dilip Lal | 50000 | 48 | 6.75 | 2018-03-22 |
| 1003 | Navin Gupta | 30000 | 36 | NULL | 2018-03-01 |
| 1004 | D.P. Yadav | 80000 | 60 | 8.25 | 2017-06-12 |
| 1005 | Jyoti Sharma | 20000 | 36 | 6.50 | 2017-01-31 |
| 1006 | Rakesh Kumar | 70000 | 60 | 8.25 | 2018-06-15 |
| 1007 | K.D. Singh | 50000 | 48 | NULL | 2018-07-05 |
| 1008 | Anjali Sharma | 60000 | 48 | 6.75 | 2017-04-02 |
| 1009 | Swati Garg | 40000 | 42 | 6.50 | 2018-06-15 |
| 1010 | Rupinder Kaur | 25000 | 36 | 6.50 | 2018-09-27 |
Write SQL commands for the statements (a) to (h) on the table Bank
(a) Display the details of all FD whose rate of interest is in the range 6% to 7%.
(b) Display the Customer Name and FD Amount for all the loans for which the number of Months is 24, 36, or 48(using IN operator).
(c) Display the Account Number, Customer Name and FD Amount for all the FD for which the Customer Name ends with “Sharma”.
(d) Delete the records of “Rupinder Kaur”.
(e) Add another column Maturity_Amt of type Integer in the Bank table.
(f) To find the average FD amount. Label the column as “Average FD Amount”.
(g) To find the total FD amount which started in the year 2018?
(h) Update Maturity Amount of all bank customers.
a. Maturity Amount = (FD_Amount*Months* Int_rate)/(12*100)