What do you understand by 'parametric shift of a line'? How does a line shift when its:
- Slope decreases,
- Its intercept decreases?
Download our app for free and get started
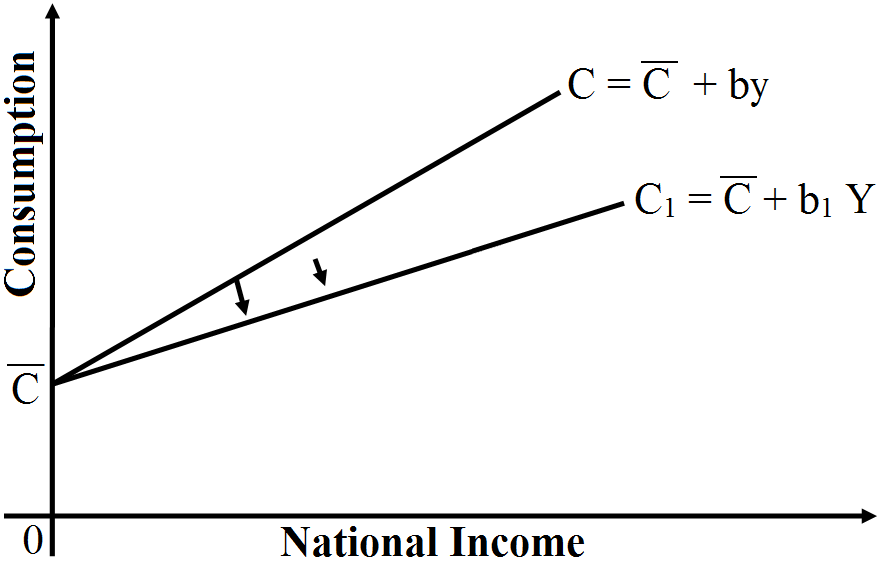
Movement along a curve vs shift of a curve. Let $\text{C}=\bar{\text{C}}+\text{bY}$ be the consumption function Also Let $\bar{\text{C}}=5$ and b = 0.75 Thus, C = 5 + 0.75Y Consider two situations:
Thus, when slope changes, there is parametric shift in the curve. When intercept changes, there is parallel shift in the curve.
- When b decreases: b is the slope of the consumption curve. When b increases from 0.75 to 0.5, then consumption curve (which is a straight line) pivots downwards. This is called a parametric shift of a graph. It is shown in the given figure:
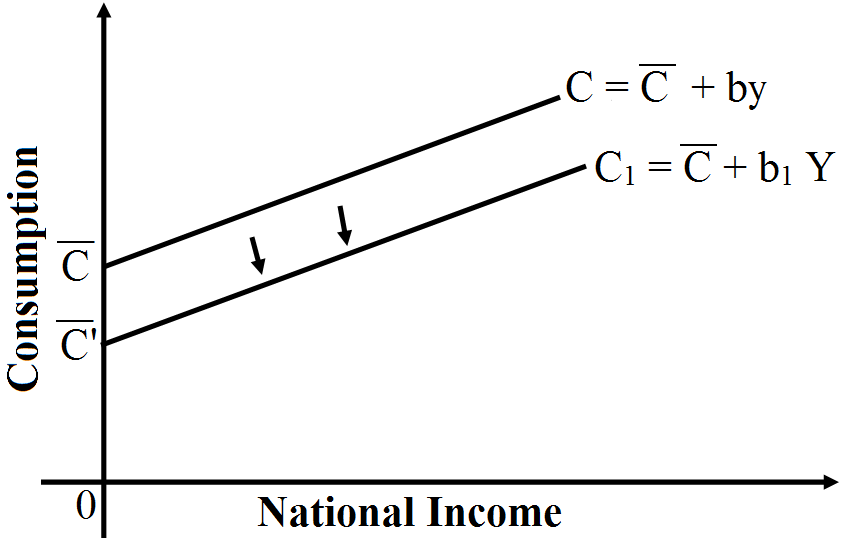
- When $\bar{\text{C}}$ decreases: It is the autonomous part of the consumption function. It graphically gives the intercept of the consumption curve. If decreases from 5 to 3, there will be parallel downward shift in the consumption curves. It is shown in the given figure:
Thus, when slope changes, there is parametric shift in the curve. When intercept changes, there is parallel shift in the curve.

Download our appand get started for free
Experience the future of education. Simply download our apps or reach out to us for more information. Let's shape the future of learning together!No signup needed.*
Similar Questions
- 1View SolutionDifferentiate between full employment and underemployment equilibrium.
- 2View SolutionAn economy is in equilibrium. Find Marginal Propensity to Consume from the following:
National income = 2000
Autonomous consumption = 400
Investment expenditure = 200 - 3View SolutionExplain the meaning of investment multiplier. What can be its minimum and maximum value and why?
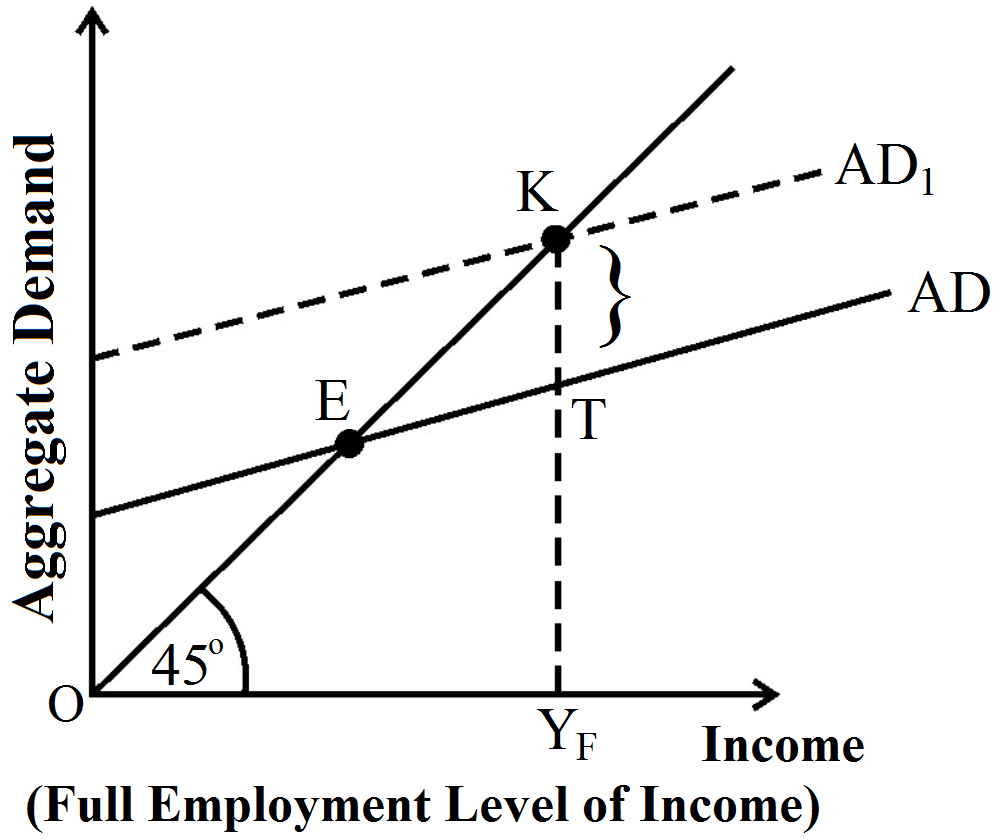
- 4View SolutionIn the given figure, what does the gap ‘KT’ represent? State any two fiscal measures to correct the situation.
- 5View SolutionIn an economy, everytime income rises, 75% of the rise in income is spent on consumption. Now, suppose in the same economy, investment rises by ₹ 750 crore. Calculate the following:
- Change in income.
- MPS.
- 6View SolutionMeasure the level of ex-ante aggregate demand when autonomous investment and consumption expenditure (A) is Rs. 50 crores, and MPS is 0.2 and level of income (Y) is Rs. 4000 crores. State whether the economy is in equilibrium or not (cite reasons).
- 7View SolutionAn economy is in equilibrium. Calculate the National Income from the following:Autonomous Consumption = 120Marginal Propensity to Save = 0·2Investment Expenditure = 150
- 8View SolutionGiving reasons, state whether the following statements are true or false:
- When marginal propensity to consume is zero, the value of investment multiplier will also be zero.
- Value of average propensity to save can never be less than zero.
- 9View SolutionAn economy is in equilibrium. Calculate the Investment Expenditure from the following:
National Income = 800
Marginal Propensity to Save = 0·3
Autonomous Consumption = 100 - 10View SolutionAs a result of increase in investment by Rs. 125 crores, national income increases by Rs. 500 crores. Calculate marginal propensity to consume.