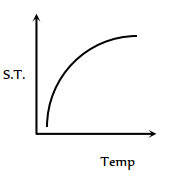
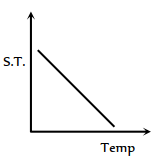
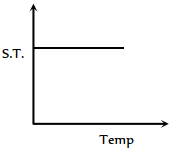
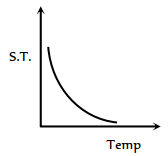
MCQ
Which graph represents the variation of surface tension with temperature over small temperature ranges for water
  • A
    Image
  • Image
  • C
    Image
  • D
    Image

Answer

Correct option: B.
Image
$T_c=T_o(1-o t)$ i.e. surface tension decreases with increase in temperature.

Need a full question paper?

Generate a complete, print-ready paper with questions like this in minutes — across 16+ boards, with answer keys.

Start Generating Free