Question
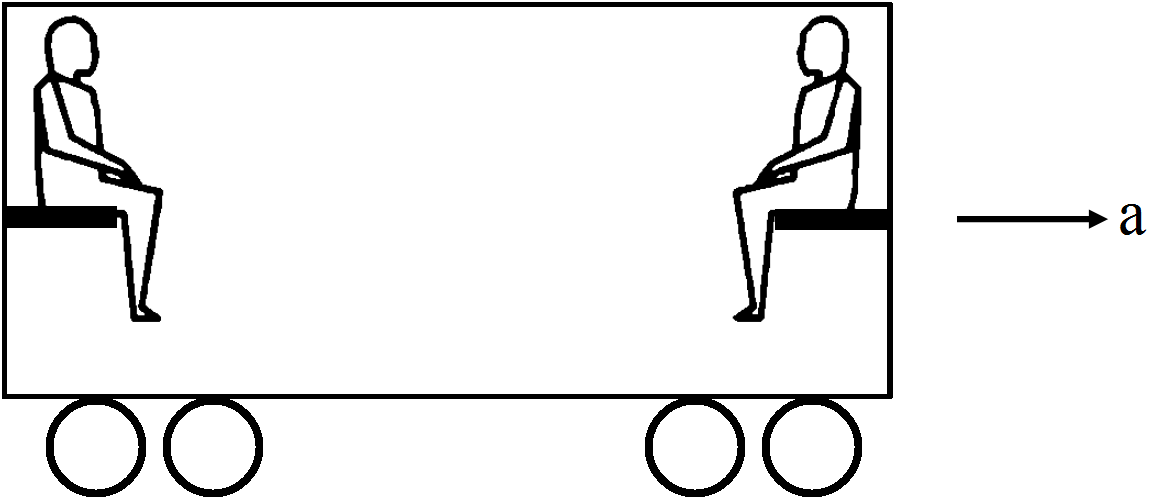
Which of the two persons shown in figure is more likely to fall down? Which external force is responsible for his falling down?
100%

Answer

The person sitting on right side of the figure is likely to fall Because of moment of inertia of the body of person his upper body is still in rest but lower body that is in contact with seat due to friction may move forward (right) as center of mass may be at the center of body the man may fall towards left.

Need a full question paper?

Generate a complete, print-ready paper with questions like this in minutes — across 16+ boards, with answer keys.

Start Generating Free

Similar questions

The charge on a proton is +1.6 × 10-19C and that on an electron is -1.6 × 10-19C. Does it mean that the electron has a charge 3.2 × 10-19C less than the charge of a proton?
Explain temperature on the basis of molecular kinetic theory.
Can the potential difference across a battery be greater than its emf?
A resistance is connected to an AC source. If a capacitor is included in the series circuit, will the average power absorbed by the resistance increase or decrease? If an inductor of small inductance is also included in the series circuit, will the average power absorbed increase or decrease further?
A newly designed thermometer has its lower fixed point and upper fixed point marked 5°C and 95°C respectively. Compute the temperature on this scale corresponding to 50°C.
A staircase contains three steps each 10cm high and 20cm wide (figure). What should be the minimum horizontal velocity of a ball rolling off the uppermost plane so as to hit directly the lowest plane?

In an open organ pipe, third harmonic is 450Hz. What is the frequency of fifth harmonic?
Find the height to which water at 4°C will rise in a capillary tube of 10-3m diameter. Take g = 9.8ms-2. Angle of contact, $\theta=0$ and T = 0.072Nm-1.
The speed-time graph for a car is shown in figure below.

  1. Find how far the car travels in the first 4s? Shade the area on the graph that represents the distance travelled by the car during the period.
  2. Which part of the graph represent uniform motion of the car?
Calculate the percentage increase in length of a wire of diameter 2.5mm stretched by a force of 100kg weight. Young's modulus of elasticity of wire is 12.5 × 10¹¹ dyne/ sq cm.