Question
With the help of given statistical data prepare a simple bar graph and answer the following questions.
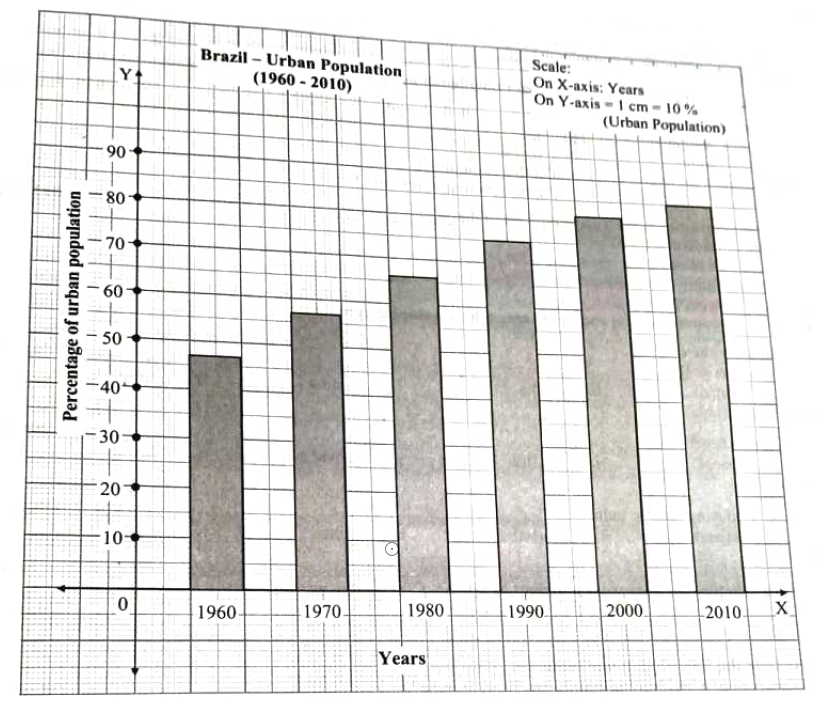
Percentage of Urban Population - Brazil
(1960 to 2010)
Questions:
1. What does the above line graph show?
2. In which decade urbanisation occurred slowly?
3. What was the percentage of increase in urbanisation during the period from 1980 to 1990 ?
Percentage of Urban Population - Brazil
(1960 to 2010)
| Years | % of Urban Population |
| 1960 | 47.1 |
| 1970 | 56.8 |
| 1980 | 66.0 |
| 1990 | 74.6 |
| 2000 | 81.5 |
| 2010 | 84.6 |
1. What does the above line graph show?
2. In which decade urbanisation occurred slowly?
3. What was the percentage of increase in urbanisation during the period from 1980 to 1990 ?