Question
Prepare a simple bar graph with the help of given statistical information and answer the questions given below-
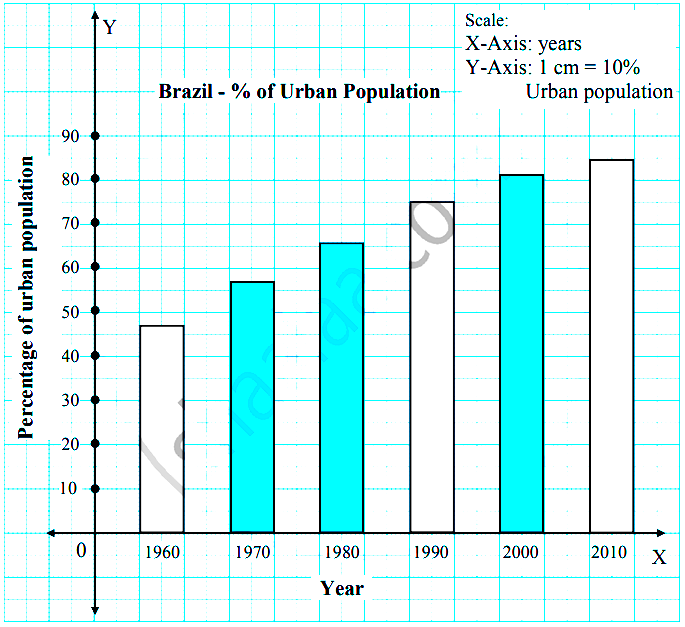
Brazil-% of urban population
| Year | % of urban population |
| 1960 | 47.1 |
| 1970 | 56.8 |
| 1980 | 66.0 |
| 1990 | 74.6 |
| 2000 | 81.5 |
| 2010 | 84.6 |
Questions-
- What is the interval of years in the data?
- During which year did rapid urbanization start?
- Write five sentences about the analysis of graph.