Question
With the help of given statistical data prepare a simple bar graph and answer the following questions.
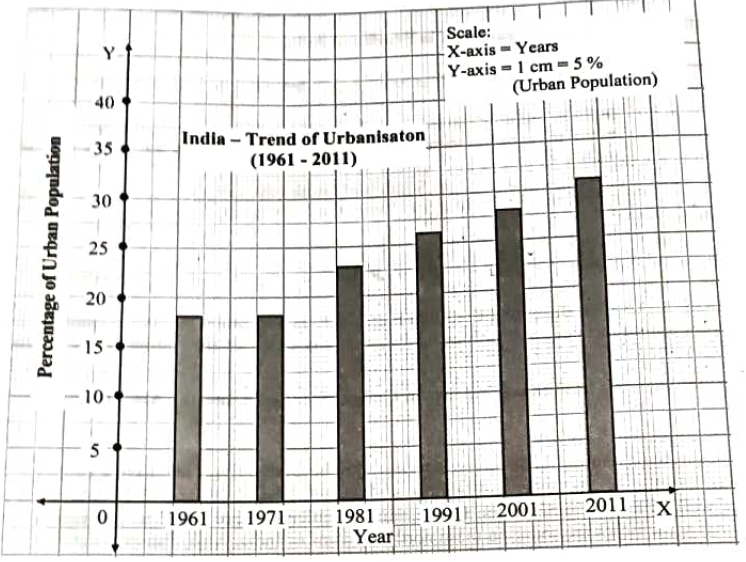
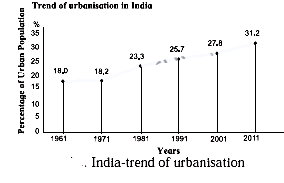
India-Trend of Urbanisation
(1961-2011)
Questions:
I. What is the interval of the data?
2. Which decade shows slow rate of urbanisation?
3. Which decade shows high rate of urbanisation?
4. What was the percentage of urbanisation in the year 1961?
India-Trend of Urbanisation
(1961-2011)
| Year | Percentage of Urban Population |
| 1961 | 18.0 |
| 1971 | 18.2 |
| 1981 | 23.3 |
| 1991 | 25.7 |
| 2001 | 27.8 |
| 2011 | 31.2 |
I. What is the interval of the data?
2. Which decade shows slow rate of urbanisation?
3. Which decade shows high rate of urbanisation?
4. What was the percentage of urbanisation in the year 1961?