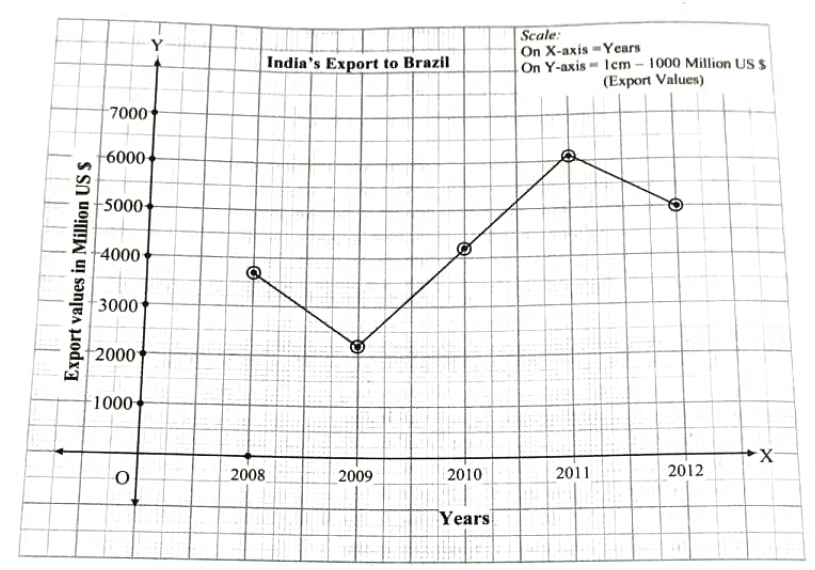
Answer


Image

1. The value of export in 2008 was 3700 million US $.
2. The export value has highest in the year 2011.
3. The value of export has been increased by 3900 millon US $ from 2009 to 2011.

Need a full question paper?

Generate a complete, print-ready paper with questions like this in minutes — across 16+ boards, with answer keys.

Start Generating Free

Similar questions

Prepare a simple bar graph with the help of given statistical information and answer the questions given below-

Brazil-life expectancy

Years Life expectancy
1960 54
1970 59
1980 61
1990 65
2000 70
2010 73
2016 75

Questions-

  1. What is the interval of years in the data?
  2. What is the difference in life expectancy of 1960 and 2016?
  3. Write five sentences about the analysis of graph.
Observe the following graph and answer the questions given below-

Brazil- % of population (2016)


  1. Which type of graph is this?
  2. Which age group has the highest population?
  3. Write class interval of age groups given on Y-axis.
  4. Whose number is more in males and females of age above 60?
  5. How much percent of females are found in age group of 55 to 59 years?
  6. After which age group is the decrease in population found?
Observe the following graph and answer the questions given below-

  1. Which country has a higher percent of the population engaged in primary activities?
  2. In which country is the contribution of tertiary sector greater in the GDP?
  3. In which country is the share of secondary activities more in the GDP?
  4. Can we say that Brazil is an agrarian economy like India? Give reasons.
  5. Which country has a higher percent of the population engaged in secondary activities?
  6. How muchpercent of population is engaged in tertiary activities in India?
Observe the following graphs and answer the questions given below them.
Image
1. What do the above graphs show?
2. Which country has highest male population?
3. Which country has highest female population?
4. Which country has rapid increase in female population after 2001?
With the help of given statistical data, prepare a simple bar graph and answer the following questions:
Life Expectancy - India
YearsLife Expectancy
198054
199058
200063
201067
201668
Questions:
1. In the year 1990 what is the average life expectancy?
2. In which two decades, the average life expectancy is found to be similar increase?
3. How much increase can be seen in the life expectancy from 1990 to 2016?
Read the graph and answer the following questions:
Image
1. What does the above graph show?
2. In which age group population is more?
3. What is the class interval of the data shown on ' Y ' axis?
4. In the age group of above 60 years whose population is more, male or female?
Read the graph in fig below and answer the following questions:

  1. What was the percentage of urbanisation in 1961?
  2. In which decade was urbanisation the highest?
  3. In which decade was the growth of urbanisation lowest?
  4. What inference can you draw regarding India’s urbanisation after reading the graph?
  5. In which decade is the percentage of urbanization 27.8?
  6. What is the difference between the percentage of urbanisation from 1971 and 1981?