Question
Prepare a simple bar graph with the help of given statistical information and answer the questions given below-

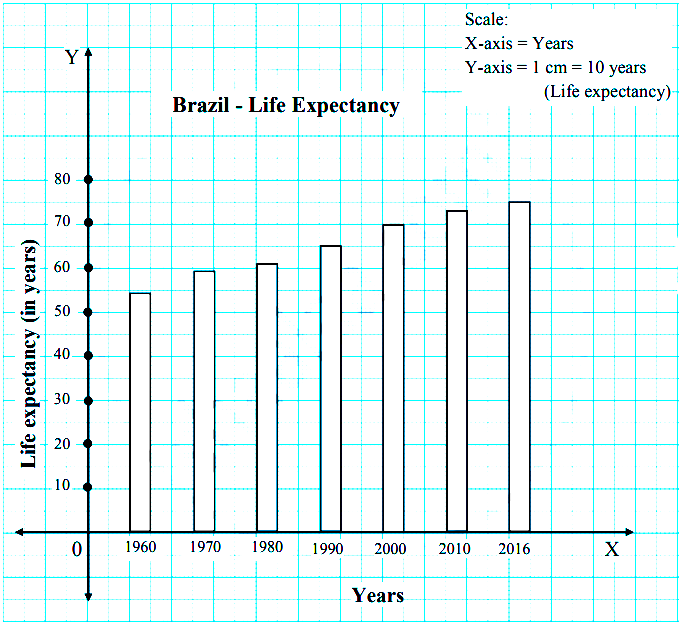
Brazil-life expectancy

Years Life expectancy
1960 54
1970 59
1980 61
1990 65
2000 70
2010 73
2016 75

Questions-

  1. What is the interval of years in the data?
  2. What is the difference in life expectancy of 1960 and 2016?
  3. Write five sentences about the analysis of graph.

Answer


  1. The interval of the data is 10 years.
  2. The difference in life expectancy of 1960 and 2016 is 21 years.
  3. i. Life expectancy is an average number of years a person born in a country is expected to live.
    ii. The graph shows that life expectancy has increased in every decade.
    iii. The life expectancy has increased by 21 years from 1960 to 2016.
    iv. The mortality rate has reduced in the last 56 years.
    v. The life expectancy has increased due to improvement in medical facilities, progress in the medical field, access to nutritious food etc.

Need a full question paper?

Generate a complete, print-ready paper with questions like this in minutes — across 16+ boards, with answer keys.

Start Generating Free

Similar questions

Observe the following graphs and answer the questions given below them.
Image
1. What do the above graphs show?
2. Which country has highest male population?
3. Which country has highest female population?
4. Which country has rapid increase in female population after 2001?
Prepare a simple bar graph with the help of given statistical information and answer the questions given below-

Brazil-% of urban population

Year % of urban population
1960 47.1
1970 56.8
1980 66.0
1990 74.6
2000 81.5
2010 84.6

Questions-

  1. What is the interval of years in the data?
  2. During which year did rapid urbanization start?
  3. Write five sentences about the analysis of graph.
Observe the following graph and answer the questions given below-

India- % of population (2016)

  1. Which type of graph is this?
  2. Which age group has the highest population?
  3. Write class interval of age groups given on Y-axis.
  4. Whose number is more in males and females of age above 60?
  5. How much percent of females are found in age group of 55 to 59 years?
  6. After which age group is the decrease in population found?
Read the graph in fig below and answer the following questions:

  1. What was the percentage of urbanisation in 1961?
  2. In which decade was urbanisation the highest?
  3. In which decade was the growth of urbanisation lowest?
  4. What inference can you draw regarding India’s urbanisation after reading the graph?
  5. In which decade is the percentage of urbanization 27.8?
  6. What is the difference between the percentage of urbanisation from 1971 and 1981?

With the help of given statistical data, prepare a simple bar graph and answer the following questions:
Life Expectancy - India
YearsLife Expectancy
198054
199058
200063
201067
201668
Questions:
1. In the year 1990 what is the average life expectancy?
2. In which two decades, the average life expectancy is found to be similar increase?
3. How much increase can be seen in the life expectancy from 1990 to 2016?
Prepare a simple bar graph with the help of given statistical information and answer the questions given below-

Export of India to Brazil (million US dollars)

Year Export
2008 3700
2009 2200
2010 4200
2011 6100
2012 5000

Questions-

  1. How much export was found in 2008?
  2. In which year highest export of India was found?
  3. How much export increased in millions between 2009 and 2011?