Question
Write a python program to plot the grouped bar chart for the given data:
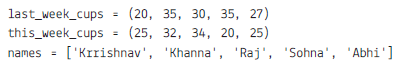
The program is to be implemented to sub plot
The program is to be implemented to sub plot
Get the step-by-step solution for this question inside the Vidyadip app.
Get the answer in the appGenerate a complete, print-ready paper with questions like this in minutes — across 16+ boards, with answer keys.
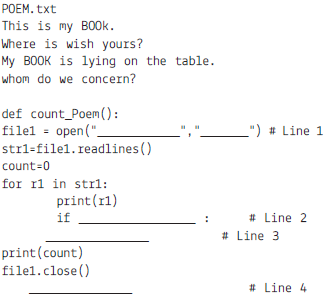
(a) # Line 1 : To open file POEM.txt in read mode
(b) # Line 2 : To check first character of every line is ‘W’ or ‘w’.
(c) # Line 3 : To increase the value of count by 1.
(d) # Line 4 : To call the function count_poem.
 1
1Consider the following DEPT and WORKER tables. Write SQL queries for (i) to (iv) and find outputs for SQL queries (v) to (viii):
Table: DEPT
| DCODE | DEPARTMENT | CITY |
| D01 | MEDIA | DELHI |
| D02 | MARKETING | DELHI |
| D03 | INFRASTRUCTURE | MUMBAI |
| D05 | FINANCE | KOLKATA |
| D04 | HUMAN RESOURCE | MUMBAI |
Table: WORKER
| WNO | NAME | DOJ | DOB | GENDER | DCODE |
| 1001 | George K | 2013-09-02 | 1991-09-01 | MALE | D01 |
| 1002 | Ryma Sen | 2012-12-11 | 1990-12-15 | FEMALE | D03 |
| 1003 | Mohitesh | 2013-02-03 | 1987-09-04 | MALE | D05 |
| 1007 | Anil Jha | 2014-01-17 | 1984-10-19 | MALE | D04 |
| 1004 | Manila Sahai | 2012-12-09 | 1986-11-14 | FEMALE | D01 |
| 1005 | R SAHAY | 2013-11-18 | 1987-03-31 | MALE | D02 |
| 1006 | Jaya Priya | 2014-06-09 | 1985-06-23 | FEMALE | D05 |
Note: DOJ refers to date of joining and DOB refers to date of Birth of workers.
(i) To display Wno, Name, Gender from the table WORKER in descending order of Wno.
(ii) To display the Name of all the FEMALE workers from the table WORKER.
(iii) To display the Wno and Name of those workers from the table WORKER who are born between ‘1987-01-01 ’and ‘1991-12-01 ’.
(iv) To count and display MALE workers who have joined after ‘1986-01-01 ’.
(v) SELECT COUNT(*), DCODE FROM WORKER GROUP BY DCODE HAVING COUNT(*)>1;
(vi) SELECT DISTINCT DEPARTMENT FROM DEPT;
(vii) SELECT NAME, DEPARTMENT, CITY FROM WORKER W,DEPT D WHERE W.DCODE=D.DCODE AND WNO <1003;
(viii) SELECT MAX(DOJ), MIN(DOB) FROM WORKER;
![]()
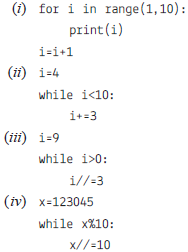
Write the complete steps to sort the above along with each pass explanation.
Answer the following question the basis of given dataframe:
| Itemno | ItemName | Color | Price | |
| 0 | 1 | Ball Pen | Black | 15.0 |
| 1 | 2 | Pencil | Blue | 5.5 |
| 2 | 3 | Ball Pen | Green | 10.5 |
| 3 | 4 | Gel Pen | Green | 11.0 |
| 4 | 5 | Notenook | Red | 15.5 |
| 5 | 6 | Ball Pen | Green | 11.5 |
| 6 | 7 | Highlighter | Blue | 8.5 |
| 7 | 8 | Gel Pen | Red | 12.5 |
| 8 | 9 | P Marker | Blue | 5.6 |
| 9 | 10 | Ball Pen | Green | 11.5 |
(i) To set the index to column Item Name.
(ii) To print the pivoting the data based on Item name as index, column as color and values as price.
(iii) To print the data as row index Itemname and columns index as color. Fill NaN as blank
(iv) To create another alias df3 and store the result of question 2.
(v) To add a new column QTY.
(vi) To print the mean priceod of all Item name and color wise.
(vii) To print the mean of the price, Item name and color margin wise.
(viii) To print the mean of the price, Item name and color wise with margins as Total.
(ix) To display the sorted data in ascending order according to the price
(x) To display the sorted data in descending order according to the price
(xi) To sort the data index wise.
(xii) To print the median.
(xiii) To print the maximum values column wise.
(xiv) To print the sum of the price.
(xv) To print the maximum of each column
(xvi) To print the first quantile of the price.
(xvii) To print the first quantile of Item no
(xviii) To print the first quartile, second quartile and third quartile. of Item no.
(xix) To print all the descriptive statistics.