Question
Write a python program using function to create the list of numeric values and search the number in the list using Linear Search Technique. The function will return –1 if element not found otherwise show the position.
Get the step-by-step solution for this question inside the Vidyadip app.
Get the answer in the appGenerate a complete, print-ready paper with questions like this in minutes — across 16+ boards, with answer keys.
Consider the following tables Product and Client. Write SQL commands for the statements (i) to (iv) and give outputs for SQL queries (v) to (viii)
TABLE: PRODUCT
| P_ID | Product Name | Manufacturer | Price |
| TP01 | Talcom Powder | LAK | 40 |
| FW05 | FaceWash | ABC | 45 |
| BS01 | Bath Soap | ABC | 55 |
| SH06 | Shampoo | XYZ | 120 |
| FW12 | Face Wash | XYZ | 95 |
TABLE: CLIENT
| C_ID | ClientName | City | P_ID |
| 01 | Cosmetic Shop | Delhi | FW05 |
| 06 | Total Health | Mumbai | BS01 |
| 12 | Live Life | Delhi | SH06 |
| 15 | Pretty Woman | Delhi | FW12 |
| 16 | Dreams | Bangalore | TP01 |
(i) To display the details of those Clients whose City is Delhi
(ii) To display the details of Products whose Price is in the range of 50 to 100 (Both values included)
(iii) To display the ClientName, City from Table Client, and ProductName and Price from table Product, with their corresponding matching P_ID
(iv) To increase the Price of all Products by 10
(v) SELECT DISTINCT CITY FROM Client;
(vi) SELECT Manufacturer, MAX(Price), Min(Price), Count(*) FROM Product GROUP BY Manufacturer;
(vii) SELECT ClientName, ManufacturerName FROM Product, Client WHERE Client.Prod_Id = Product.P_Id;
Answer the following question the basis of given dataframe:
| Itemno | ItemName | Color | Price | |
| 0 | 1 | Ball Pen | Black | 15.0 |
| 1 | 2 | Pencil | Blue | 5.5 |
| 2 | 3 | Ball Pen | Green | 10.5 |
| 3 | 4 | Gel Pen | Green | 11.0 |
| 4 | 5 | Notenook | Red | 15.5 |
| 5 | 6 | Ball Pen | Green | 11.5 |
| 6 | 7 | Highlighter | Blue | 8.5 |
| 7 | 8 | Gel Pen | Red | 12.5 |
| 8 | 9 | P Marker | Blue | 5.6 |
| 9 | 10 | Ball Pen | Green | 11.5 |
(i) To set the index to column Item Name.
(ii) To print the pivoting the data based on Item name as index, column as color and values as price.
(iii) To print the data as row index Itemname and columns index as color. Fill NaN as blank
(iv) To create another alias df3 and store the result of question 2.
(v) To add a new column QTY.
(vi) To print the mean priceod of all Item name and color wise.
(vii) To print the mean of the price, Item name and color margin wise.
(viii) To print the mean of the price, Item name and color wise with margins as Total.
(ix) To display the sorted data in ascending order according to the price
(x) To display the sorted data in descending order according to the price
(xi) To sort the data index wise.
(xii) To print the median.
(xiii) To print the maximum values column wise.
(xiv) To print the sum of the price.
(xv) To print the maximum of each column
(xvi) To print the first quantile of the price.
(xvii) To print the first quantile of Item no
(xviii) To print the first quartile, second quartile and third quartile. of Item no.
(xix) To print all the descriptive statistics.
As a network consultant, you have to suggest the best network related solutions for their issues/problems raised in (a) to (d), keeping in mind the distances between various locations and other given parameters.
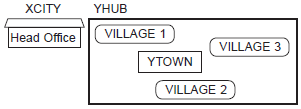
Shortest distance between various locations:
| VILLAGE 1 to YTOWN | 2 KM |
| VILLAGE 2 to YTOWN | 1.5 KM |
| VILLAGE 3 to YTOWN | 3 KM |
| VILLAGE 1 to VILLAGE 2 | 3.5 KM |
| VILLAGE 1 to VILLAGE 3 | 4.5 KM |
| VILLAGE 2 to VILLAGE 3 | 3.5 KM |
| CITY Head Office to YHUB | 30 KM |
Number of computers installed at various locations are as follows:
| YTOWN | 100 |
| VILLAGE 1 | 10 |
| VILLAGE 2 | 15 |
| VILLAGE 3 | 15 |
| CITY OFFICE | 5 |
Note:
• In Villages, there are community centers, in which one room has been given as training center to this organization to install computers.
• The organization has got financial support from the government and top IT companies.
(a) Suggest the most appropriate location of the SERVER in the YHUB (out of the 4 locations), to get the best and effective connectivity. Justify your answer.
(b) Suggest the best wired medium and draw the cable layout (location to location) to efficiently connect various locations within the YHUB.
(c) Which hardware device will you suggest to connect all the computers within each location of YHUB?
(d) Which service/protocol will be most helpful to conduct live interactions of Experts from Head Office and people at YHUB locations?
