Write a script to create an empty list and then
(a) Input the names of 10 students and store them in the list using concatenation operator
(b) Display this list of names in reverse order
Write a script to create an empty list and then
(a) Input the names of 10 students and store them in the list using concatenation operator
(b) Display this list of names in reverse order
Get the step-by-step solution for this question inside the Vidyadip app.
Get the answer in the appGenerate a complete, print-ready paper with questions like this in minutes — across 16+ boards, with answer keys.
| animal | age | visits | priority | |
| a | cat | 2.5 | 1 | yes |
| b | cat | 3.0 | 3 | yes |
| c | snake | 0.5 | 2 | No |
| d | dog | NaN | 3 | yes |
| e | dog | 5.0 | 2 | No |
| f | cat | 2.0 | 3 | No |
| g | snake | 4.5 | 1 | No |
| h | cat | NaN | 1 | yes |
| i | dog | 7.0 | 2 | No |
| j | dog | 3.0 | 1 | No |
(a) To create the dataframe from the above dictionary and index is stored in label list.
(b) To display the Data frame.
(c) To calculate the sum of all visits (the total number of visits).
(d) Calculate the mean age for each different animal in df
(e) To Append a new row 'k' to df with your choice of values for each column.
(f) To delete the new entered row.
(g) To count the number of each type of animal in df.
(h) To sort df first by the values in the 'age' in descending order, then by the value in the 'visit' column in ascending order.
(i) To print the maximum values of each column.
(j) To display all the statistics.
(k) To sort the data according the index.
Building to Building distances (in Mtrs.)
| FROM | To | Distance |
| Administrative Building | Finance Building | 60 |
| Administrative Building | Faculty Studio building | 120 |
| Finance Building | Faculty Studio building | 70 |
Number of computers in each of the blocks/Center is as follows:
| Administrative Building | 20 |
| Finance Building | 40 |
| Faculty Studio building | 120 |
(a) Suggest the most appropriate building, where EPG should plan to install the server.
(b) Suggest the most appropriate building to building cable layout to connect all three buildings for efficient communication.
(c) Which type of network out of the following is formed by connecting the computers of these three buildings?
LAN, MAN, WAN
(d) Which wireless channel out of the following should be opted by EPG to connect to students of all over the world?
Infrared, Microwave, Satellite
| TNO | Tname | Tadd | Salary | |
| 0 | T01 | Amit | 123 Paschim Vihar | 23000 |
| 1 | T02 | Rajesh | 6/11 Ramesh Nagar | 34000 |
| 2 | T03 | Binny | 5 West Punjabhi Bagh | 12000 |
| 3 | T04 | Charu | 23Malviya Nagar | 45000 |
| 4 | T05 | Meenakshi | 19 Meera Bagh | 34000 |
(i) To write the statement to import the required library.
(ii) To create the data frame from the above dictionary.
(iii) To print the data frame.
(iv) To print the name columns.
(v) To print the complete information of the data frame.
(vi) To print the index of data frame.
(vii) To print the various attributes of the data frame i.e Shape, Dimensions, Columns and number of records.
(viii) To print the records whose salary is greater than 5000.
(ix) To create another data frame which will store all the records of the teacher whose salary is greater than 5000.
(x) To display the Salary.
(xi) To set the index to the column 'Tname'.
(xii) To display the record of 'Amit'.
(xiii) To display the record fo 'Amit' and 'Binny'
(xiv) To display the Salary and Address of 'Amit' and 'Binny'.
(xv) To display the records of the teachers whos are earning salary more than 10000.
(xvi) To display the records of the teachers whos are earning salary less than 40000.
(xvii) To add new column Dearness Allowance with any values.
(xviii) To add new column "HRA" using .loc().
(xix) To add new column tax using assign().
(xx) To display the HRA column.
(xxi) To display the records of the Teachers who have HRA of more than 500.
(xxii) To add a new column Total Salary which is to be calculated as Salary + HRA - Tax.
(xxiii) To fill all NaN values with 5000.
(xxiv) To replace all the NaN with space.
(xxv) To Update the new colum with values as Salary + HRA + Dearness Allowance - Tax
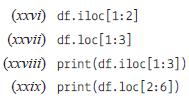
Write the output of the given commands:
Answer the following question the basis of given dataframe:
| Itemno | ItemName | Color | Price | |
| 0 | 1 | Ball Pen | Black | 15.0 |
| 1 | 2 | Pencil | Blue | 5.5 |
| 2 | 3 | Ball Pen | Green | 10.5 |
| 3 | 4 | Gel Pen | Green | 11.0 |
| 4 | 5 | Notenook | Red | 15.5 |
| 5 | 6 | Ball Pen | Green | 11.5 |
| 6 | 7 | Highlighter | Blue | 8.5 |
| 7 | 8 | Gel Pen | Red | 12.5 |
| 8 | 9 | P Marker | Blue | 5.6 |
| 9 | 10 | Ball Pen | Green | 11.5 |
(i) To set the index to column Item Name.
(ii) To print the pivoting the data based on Item name as index, column as color and values as price.
(iii) To print the data as row index Itemname and columns index as color. Fill NaN as blank
(iv) To create another alias df3 and store the result of question 2.
(v) To add a new column QTY.
(vi) To print the mean priceod of all Item name and color wise.
(vii) To print the mean of the price, Item name and color margin wise.
(viii) To print the mean of the price, Item name and color wise with margins as Total.
(ix) To display the sorted data in ascending order according to the price
(x) To display the sorted data in descending order according to the price
(xi) To sort the data index wise.
(xii) To print the median.
(xiii) To print the maximum values column wise.
(xiv) To print the sum of the price.
(xv) To print the maximum of each column
(xvi) To print the first quantile of the price.
(xvii) To print the first quantile of Item no
(xviii) To print the first quartile, second quartile and third quartile. of Item no.
(xix) To print all the descriptive statistics.