MCQ 511 Mark
The mean of $50$ observations is $39.$ If one of the observations which was $23$ was replaced by $43,$ the resulting mean will be:
- A
$38.4$
- B
$39$
- C
$40.3$
- ✓
$39.4$
AnswerCorrect option: D. $39.4$
The mean of $50$ observations is $39.$
So sum of these $50$ observations is $50 × 39 = 1950$
After replacing the observation value $23$ by $43,$
Sum becomes $1970$
So the mean is $\frac{1970}{50}=39.4$
View full question & answer→MCQ 521 Mark
$\text{Mode}+\frac{2}{3}(\text{Mean - Mode})=$
AnswerSince, $3$ Median $=$ Mode $+\ 2$ Mean
$\Rightarrow\text{Median}=\frac{\text{Mode}}{3}+\frac{2}{3}\text{Mean}$
$=\frac{\text{Mode}}{3}+\frac{2}{3}\text{Mean}-\frac{2}{3}\text{Mode}+\frac{2}{3}\text{Mode}$
$\text{Median}=\text{Mode}+\frac{2}{3}(\text{Mean - Mode})$
View full question & answer→MCQ 531 Mark
Which one of the following is not a measure of central tendency?
AnswerMedian and Mode are the most common measures of central tendency.
These may be considered depending on the type of data and data distribution
Variance measures how far the data set is spread out and is not a measure of central tendency.
View full question & answer→MCQ 541 Mark
The median of the data $78, 56, 22, 34, 45, 54, 39, 68, 54, 84$ is:
AnswerFirst, we arrange the given observations in ascending order as follows
$22, 34, 39, 45, 54, 54, 56, 68, 78$ and $84$
Here, total number of observation, $n = 10$
Since, $n$ is even, so we use the formula for median,
Median $=\frac{\big(\frac{\text{n}}{2}\big)^{-1}\text{observation +}\big(\frac{\text{n}}{2}+1\big)\text{th observation}}{2}$
$=\frac{\big(\frac{10}{2}\big)\text{ th observation +}\big(\frac{10}{2}+1\big)\text{th observation}}{2} [$put $n = 10]$
$=\frac{5\text{th observation $+ 6th$ obsevation}}{2}=\frac{54+54}{2}=\frac{108}{2}=54$
Hence, the median of given data is $54.$
View full question & answer→MCQ 551 Mark
In a histogram, which of the following is proportional to the frequency of the corresponding class?
- ✓
- B
Perimeter of the rectangle.
- C
- D
AnswerIn, Histogram each rectangle is drawn, where width equivalent to class interval and height equivalent to the frequency of the class.
Since class interval are same across the distribution table, area of the rectangle is corresponding to frequency or height of the rectangle.
View full question & answer→MCQ 561 Mark
Write the correct answer in the following:
To draw a histogram to represent the following frequency distribution:
|
Class intervai
|
$5-10$
|
$10-15$
|
$15-25$
|
$25-45$
|
$45-75$
|
|
Frequency
|
$6$
|
$12$
|
$10$
|
$8$
|
$15$
|
The adjusted frequency for the class $25-45$ is: AnswerThe adjusted frequency for the class $25 - 45$ is
$= \frac{\text{Frequency of the class }}{\text{Class width }}\times \text{Minimum width }=\frac{8}{20} \times5=2$
View full question & answer→MCQ 571 Mark
The difference between the highest and lowest values of the observations is called:
AnswerThe difference between the highest and lowest values of the observations is called the range.
Hence, the correct choice is $(c)$
View full question & answer→MCQ 581 Mark
For the set of numbers $2, 2, 4, 5$ and $12,$ which of the following statements is true$?$
- A
Mean $=$ Median.
- ✓
Mean $>$ Mode.
- C
Mean $>$ Mode.
- D
Mode $=$ Median.
AnswerCorrect option: B. Mean $>$ Mode.
Median $= 4$
Mode $= 2$
$\text{Mean}=\frac{2+2+4+5+12}{5}=\frac{25}{5}=5$
Hence, $($Mean $= 5) > ($Mode $= 2)$
View full question & answer→MCQ 591 Mark
The following is the data of wages per day: $5, 4, 7, 5, 8, 8, 8, 5, 7, 9, 5, 7, 9, 10, 8.$ The mode of the data is:
- A
$7$ and $8$
- B
$10$ and $12$
- ✓
$5$ and $8$
- D
$8$ and $10$
AnswerCorrect option: C. $5$ and $8$
The given data is $5, 4, 7, 5, 8, 8, 8, 5, 7, 9, 5, 7, 9, 10$ and $8$
Make the frequency table.
|
Value
|
Tallybars
|
Frequency
|
|
$4$
|
$|$ |
$1$
|
|
$5$
|
$|||||$
|
$4$
|
|
$7$
|
$|||$ |
$3$
|
|
$8$
|
$||||$ |
$4$
|
|
$9$
|
$||$ |
$2$
|
|
$10$
|
$|$ |
$1$
|
Since the value $5$ and $8$ occurs in the data maximum number of times, that is, $4.$ Hence, the modal value is $5$ and $8.$ In this case the mode is not unique. View full question & answer→MCQ 601 Mark
Write the correct answer in the following:
For drawing a frequency polygon of a continous frequency distribution, we plot the points whose ordinates are the frequencies of the respective classes and abcissae are respectively:
- A
Upper limits of the classes.
- B
Lower limits of the classes.
- ✓
Class marks of the classes.
- D
Upper limits of perceeding classes.
AnswerCorrect option: C. Class marks of the classes.
Abcissac are the class marks of the classes.
View full question & answer→MCQ 611 Mark
The mean of $n$ observations is $\overline{\text{X}}.$ If each observation is multiplied by $k,$ the mean of new observations is:
- ✓
$\text{k}\overline{\text{X}}$
- B
$\frac{\overline{\text{X}}}{\text{k}}$
- C
$\overline{\text{X}}+\text{k}$
- D
$\overline{\text{X}}-\text{k}$
AnswerCorrect option: A. $\text{k}\overline{\text{X}}$
Mean$=\overline{\text{X}}=\frac{\text{Sum of all observations}}{\text{Total number of observations}}$
$=\frac{\text{Sum of all observations}}{\text{n}}$
if each observation is multiplied by $k,$ then
New Mean,$\overline{\text{X'}}=\frac{(\text{Sum of all observations})\text{k}}{\text{n}}$
$\Rightarrow\overline{\text{X}'}=\text{k}\overline{\text{X}}$
View full question & answer→MCQ 621 Mark
A frequency polygon is constructed by plotting frequency of the class interval and the:
- A
- B
Upper limit of the class.
- C
Lower limit of the class.
- ✓
AnswerA frequency polygon is a type of line graph that shows the frequency of a mutually exclusive event occurring. Seeing the data in this format helps us visualize and understand it better. All frequency polygons must have a title, $x - ax$ is, $y - ax$ is, and data points with a line connecting them.
View full question & answer→MCQ 631 Mark
The empirical relation between mean, mode and median is:
- ✓
Mode $= 3$ Median $- 2$ Mean.
- B
Mode $= 2$ Median $- 3$ Mean.
- C
Median $= 3$ Mode $- 2$ Mean.
- D
Mean $= 3$ Median $- 2$ Mode.
AnswerCorrect option: A. Mode $= 3$ Median $- 2$ Mean.
The empirical Relation between mean, median and mode is:
Mode $= 3$ Median $- 2$ mean.
View full question & answer→MCQ 641 Mark
Which of the following variables are discrete$?$
$1.$ Size of shoes.
$2.$ Number of pages in a book.
$3.$ Distance travelled by a train.
$4.$ Time.
- A
$2$ and $4$
- B
$1$ and $3$
- C
$1$ and $4$
- ✓
$1$ and $2$
AnswerCorrect option: D. $1$ and $2$
Discrete variables are variables that can only take finite values.
Size of shoes $\&$ pages in the book have finite number.
View full question & answer→MCQ 651 Mark
In the following distribution:
|
Wages(in Rs)
|
No of workers
|
|
More than $140$
|
$12$
|
|
More than $130$
|
$27$
|
|
More than $120$
|
$60$
|
|
More than $110$
|
$105$
|
|
More than $100$
|
$124$
|
|
More than $90$
|
$141$
|
|
More than $80$
|
$150$
|
The number of workers having wage range $($in $Rs.) 110-120$ is: Answer
|
Wages(in Rs)
|
No of workers
|
|
$140–150$
|
$12$
|
|
$130–140$
|
$15$
|
|
$120–130$
|
$33$
|
|
$110–120$
|
$45$
|
|
$100–90$
|
$19$
|
|
$90–100$
|
$17$
|
|
$80–90$
|
$9$
|
Therefore, the number of workers having a wage range $($in Rs.$) 110-120$ is $45$ View full question & answer→MCQ 661 Mark
If the arithmetic mean of $7, 5, 13, x$ and $9$ is $10,$ then the value of $x$ is:
AnswerThe given data is $7, 5, 13, x$ and $9.$ They are $5$ in numbers.
The mean is $\frac{7+5+13+\text{x}+9}{5}=\frac{34+\text{x}}{5}$
But, it is given that the mean is $10$. Hence, we have
$\frac{34+\text{x}}{5}=10$
$⇒ 34 + x = 50$
$⇒ x = 50 - 34$
$⇒ x = 16$
View full question & answer→MCQ 671 Mark
The graph given below shows the frequency distribution of the age of $22$ teachers in a school. The number of teachers whose age is less than $40$ years is:
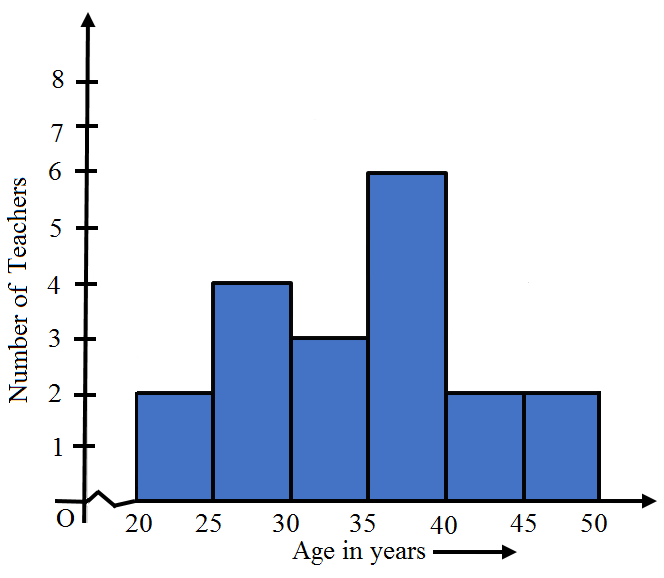
AnswerAdd the values corresponding to the height of the bar before $40.$
$6 + 3 + 4 + 2 = 15$
View full question & answer→MCQ 681 Mark
The range of the data $12, 25, 15, 18, 17, 20, 22, 6, 16, 11, 8, 19, 10, 30, 20, 32$ is:
AnswerDifference between the maximum & minimum value of the observation is called as range.
So, $32 - 6 = 26$
View full question & answer→MCQ 691 Mark
Write the correct answer in the following: The width of five continuous classes in a frequency distribution is $5$ and the lower class-limit of the lowest class is $10.$ The upper class-limit of the highest class is:
AnswerSol. Width of each of the five continuous classes in a frequency distribution is $5.$
Lower class limit of the lowest class $= 10$
Upper class limit of the lowest class is $10 + 5 = 15$
So, the five continuous classes are
$10 - 15, 15 - 20, 20 - 25, 25 - 30, 30 - 35$
Hence, the upper-class limit of the height class is $35.$
View full question & answer→MCQ 701 Mark
In a grouped frequency distribution, the class intervals are $0-10, 10-20, 20-30,...$ then the class width is:
AnswerThe class width is the difference between the upper- or lower-class limits of consecutive classes. In this case, class width equals to the difference between the lower limits of the first two classes.
$w = 10 - 0$
So, the class width is $10$
View full question & answer→MCQ 711 Mark
Write the correct answer in the following:In the class intervals $10–20, 20–30,$ the number $20$ is included in:
AnswerCorrect option: B. $20–30$
The number $20$ is included in $20–30.$
Hence, $(b)$ is the correct answer.
View full question & answer→MCQ 721 Mark
Which of the following variables are discrete?
$A.$ Size of shoes.
$B.$ Number of pages in a book.
$C.$ Distance travelled by a train.
$D.$ Time.
- A
$B$ and $D$
- ✓
$A$ and $B$
- C
$A$ and $C$
- D
$A$ and $D$
AnswerCorrect option: B. $A$ and $B$
Discrete variables are variables that can only take finite values.
Size of shoes and pages in the book have a finite number.
View full question & answer→MCQ 731 Mark
The class marks of a frequency distribution are as given below: $38, 43, 48, 53, 58.$ The class corresponding to the class mark $43$ is:
- A
$38 - 48$
- ✓
$40.5 - 45.5$
- C
$38.5 - 48.5$
- D
$35.5 - 45.5$
AnswerCorrect option: B. $40.5 - 45.5$
As the class size $= 5,$ Class interval is got by subtracting and adding $2.5$ to $43.$
View full question & answer→MCQ 741 Mark
Let $m$ be the mid-point and $l$ be the upper class limit of a class in a continuous frequency distribution. The lower class limit of the class is:
- A
$2m + I$
- B
$2I - m$
- ✓
$2m - I$
- D
$m - I$
AnswerCorrect option: C. $2m - I$
Let the lower limit $= k$
Mid-point $= m$
Upper limit $= l$
Mid-point $=\frac{\text{(upper limit + lower limit)}}{2}$
$\text{m}=\frac{(\text{k+l})}{2}$
$2\text{m}=\text{k}+\text{l}$
$\text{k}=2\text{m}-\text{l}$
Therefore, lower limit $= 2m - l$
View full question & answer→MCQ 751 Mark
To represent the more than type graphically, we plot the $...........$ on the $x-$axis.
AnswerThe lower limit for every class is the smallest value in that class on the other hand the upper limit for every class is the greatest value in that class.
To represent $'t$he more than type$’$ graphically, we plot the lower limits on the $x-$axis and cumulative frequency on the $y-$axis to find the median.
View full question & answer→MCQ 761 Mark
The mean of six numbers is $23.$ If one of the numbers is excluded, the mean of the remaining numbers becomes $20.$ The excluded number is:
AnswerThe mean of the six numbers is $23.$
So the sum of six numbers is $23 × 6 = 138$
After excluding one number, the mean of the remaining numbers is $20.$
So the sum of five numbers is $20 × 5 = 100$
The difference between them is$138 - 100 = 38$
View full question & answer→MCQ 771 Mark
The following observations have been arranged in an ascending order: $18, 20, 25, 26, 30, x, 37, 38, 39, 48$. If the median of the data is $35,$ then the value of $x$ is:
AnswerThe median is the middle score for a set of data that has been arranged in ascending or descending order of magnitude.
for even number of observations, median is calculated as average of two middle number.
for the given example $30$ and $x$ are in the middle and median is $35.$
So,
$35=\frac{30+\text{x}}{2}$
$70=30+\text{x}$
$\text{x}=40$
View full question & answer→MCQ 781 Mark
The number of times a particular item occurs in a given data is called its.
AnswerThe number of times a particular item occurs in a given data is called its Frequency.
View full question & answer→MCQ 791 Mark
The median of the data arranged in ascending order $8, 9, 12, 18, (x + 2), (x + 4), 30, 31, 34, 39$ is $24.$ The value of $x$ is:
AnswerThe given data is in ascending order.
Here, $n$ is $10,$ which is an even number. Thus, we have:
Median $=$ mean of $\Big(\frac{\text{n}}{2}\Big)\text{th}$ and $\Big(\frac{\text{n}}{2}+1\Big)\text{th}$ observations $=\frac{1}{2}$ $(5th$ observation $+\ 6th$ observation$)$
$=\frac{1}{2}(\text{x}+2+\text{x}+4)=(\text{x}+3)$
$= 24$
Also, $x + 3 = 24$
$⇒ x = 21$
View full question & answer→MCQ 801 Mark
The mean of five observations is $15.$ If the mean of first three observations is $14$ and that of last three is $17$, then the third observation is:
AnswerThe mean of five observations is $15$
So the sum of these five observations is $15 × 5 = 75$
The mean of first three observations is $14$
So the sum of the first three observations is $14 × 3 = 42$
So the sum of the last two numbers is $75 - 42 = 33$
The mean of the last three observations is $17.$
So sum of last three observations is $17 × 3 = 51$
So the middle number is $51 - 33 = 18.$
View full question & answer→MCQ 811 Mark
The mode of $4, 6, 7, 8, 12, 11, 13, 9, 13, 9, 7, 8, 9$ is:
AnswerIn statistics, the mode in a list of numbers refers to the integers that occurs most number of times.
for the set of numbers, $9$ occurs three times i.e more than any other number in the list.
View full question & answer→MCQ 821 Mark
Observe the table given below and choose the correct alternative: The class mark for $R$ is:
|
Column
|
$P$
|
$Q$
|
$R$
|
$S$
|
$T$
|
$E$
|
|
Marks scored
|
$30-40$
|
$40-50$
|
$50-60$
|
$6-70$
|
$70-80$
|
$80-90$
|
|
Number if students
|
$4$
|
$8$
|
$12$
|
$10$
|
$7$
|
$4$
|
AnswerClass mark $=\frac{\text{( upper limit + Lower limit ) }}{2}$
$=\frac{50+60}{2}$
$=\frac{110}{2}$
So class mark is $55.$
View full question & answer→MCQ 831 Mark
The numbers $2, 3, 4, 4, 2x + 1, 7, 7, 8$ and $9$ are written in an ascending order. If the median is $7,$ then mode of this data is:
AnswerThe median is the middle score for a set of data that has been arranged in ascending or descending order of magnitude.
Since $2x + 1$ is in the middle of the arranged numbers, so it is median
Hence, $2x + 1 = 7$
Now since $7$ occurs more number of times then other numbers so mode of the list is $7.$
View full question & answer→MCQ 841 Mark
For drawing a frequency polygon of a continuous frequency distribution, we plot the points whose ordinates are the frequency of respective classes and abscissa are respectively:
- ✓
Class marks of the classes.
- B
Lower limits of the classes.
- C
Upper limits of the classes.
- D
Upper limits of preceeding classes.
AnswerCorrect option: A. Class marks of the classes.
Frequency polygon is the line graph plotted with class marks on $x-$axis $\&$ frequency of the class on $y-$axis.
View full question & answer→MCQ 851 Mark
In a bar graph if $1\ cm$ represents $30\ km$, then the length of bar needed to represent $75\ km$ is:
- A
$2\ cm$
- B
$3\ cm$
- C
$3.5\ cm$
- ✓
$2.5\ cm$
AnswerCorrect option: D. $2.5\ cm$
$1\ cm = 30\ km$
So for $75\ km$
$\frac{75}{30}=2.5\text{cm}$
View full question & answer→MCQ 861 Mark
Sheila received $x$ marks in two of her tests and $y$ marks in three other tests. Her average score in all the five tests in terms of $x$ and $y$ is:
- A
$\frac{3\text{x}+2\text{y}}{5}$
- ✓
$\frac{2\text{x}+3\text{y}}{5}$
- C
$\frac{2\text{x}+3\text{y}}{2}$
- D
$\frac{3\text{x}+2\text{y}}{3}$
AnswerCorrect option: B. $\frac{2\text{x}+3\text{y}}{5}$
Average is equal to the sum of all the values in the data set divided by the number of values in the data set.
Average $=\frac{\text{x}+\text{x}+\text{y}+\text{y}+\text{y}}{5}$
Average $=\frac{2\text{x}+3\text{y}}{5}$
View full question & answer→MCQ 871 Mark
The mean of a set of seven numbers is $81$. If one of the numbers is discarded, the mean of the remaining numbers is $78$. The value of discarded number is:
AnswerGiven that the mean of $7$ numbers is $81$. Let us denote the numbers by $X_1, \ldots . X_7$
If $\overline{\text{X}}$ be the mean of the n observations $X_1, \ldots X_n$, then we have
$\overline{\text{X}}=\frac{1}{2}\sum_{\text{i}=1}^{\text{n}}\text{x}_\text{i}$
$\Rightarrow\sum_{\text{i}=1}^{\text{n}}\text{x}_\text{i}=\text{n}\overline{\text{X}}$
Hence the sum of $7$ numbers is
$\sum_{\text{i}=1}^{7}\text{x}_\text{i}=7\times81=567$
If one number is discarded then the mean becomes $78$ and the total numbers become $6.$
Let the number discarded is $x.$
After discarding one number the sum becomes $567 - x $ and then the mean is
$\frac{567-\text{x}}{6}$
But it is given that after discarding one number the mean becomes $78.$
Hence we have
$\frac{567-\text{x}}{6}=78$
$\Rightarrow 567 - x = 468$
$\Rightarrow 567 = x + 468$
$\Rightarrow x = 468 = 567$
$\Rightarrow x = 567 - 468$
$\Rightarrow x = 99$
Thus the excluded number is $99.$
View full question & answer→MCQ 881 Mark
If the mean of five observations $x, x + 2, x + 4, x + 6, x + 8,$ is $11,$ then the mean of first three observations is:
AnswerMean of first five observations $=\frac{\text{x}+\text{x}+2+\text{x}+4+\text{x}+6+\text{x}+8}{5}=11$
$⇒ 5x + 20 = 55$
$⇒ x = 7$
$⇒$ First three numbers are $7, 9, 11$
$\text{Mean}=\frac{7+9+11}{3}=\frac{27}{3}=9$
View full question & answer→MCQ 891 Mark
Write the correct answer in the following: A grouped frequency distribution table with classes of equal sizes using $63-72 (72$ included$)$ as one of the class is constructed for the following data: $30, 32, 45, 54, 74, 78, 108, 112, 66, 76, 88, 40, 14, 20, 15, 35, 44, 66, 75, 84, 95, 96, 102, 110, 88, 74, 112, 14, 34, 44.$ The number of classes in the distribution will be:
AnswerMinimum value $= 14$
Maximum value $= 112$
The classes are
$13 - 22, 23 - 32, 33 - 42, 43 - 52, 53 - 62, 63 - 72, 73 - 82, 83 - 92, 93 - 102$ and $103 - 112.$
The number of classes in the distribution will be $10.$
View full question & answer→MCQ 901 Mark
The mean of $50$ observations is $39.$ If one of the observations which was $23$ was replaced by $43,$ the resulting mean will be:
- A
$40.3$
- ✓
$39.4$
- C
$38.4$
- D
$39$
AnswerCorrect option: B. $39.4$
The mean of $50$ observations is $39.$
So sum of these $50$ observations is $50 × 39 = 1950$
After replacing the observation value $23$ by $43,$
Sum becomes $1970$
So the mean is $\frac{1970}{50}=39.4$
View full question & answer→MCQ 911 Mark
The mean of the following data is $8.$
| $x$ |
$3$ |
$5$ |
$7$ |
$9$ |
$11$ |
$13$ |
| $y$ |
$6$ |
$8$ |
$15$ |
$p$ |
$8$ |
$4$ |
Then, the value of $p$ is: AnswerFor calculating the mean, we prepare the table below:
| $x_i$ |
$f_i$ |
$x_i \times f_i$ |
| $3$ |
$6$ |
$18$ |
| $5$ |
$8$ |
$40$ |
| $7$ |
$15$ |
$105$ |
| $9$ |
$p$ |
$9p$ |
| $11$ |
$8$ |
$88$ |
| $13$ |
$4$ |
$52$ |
| |
$\sum\text{f}_\text{i}=(41+\text{p})$ |
$\sum(\text{x}_\text{i}\times\text{f}_\text{i})=(303+9\text{p})$ |
Mean $=\frac{\sum(\text{x}_\text{i}\times\text{f}_\text{i})}{\sum\text{f}_\text{i}}=\frac{303+9\text{p}}{41+\text{p}}$
But mean $= 8$
$=\frac{303+9\text{p}}{41+\text{p}}=8$
$\Rightarrow303+9\text{p}=8(41+\text{p})$
$\Rightarrow303+9\text{p}=328+8\text{p}$
$\Rightarrow\text{p}=25$ View full question & answer→MCQ 921 Mark
Let $\bar{x}$ be thae mean of $x_1, x_2, \ldots . ., x_n$, and $\bar{y}$ the mean of $y_1, y_2, \ldots, y_n$. If $\bar{z}$ is the mean of $x_1, x_2, \ldots, x_n, y_1, y_2, \ldots, y n$, then $\bar{z}$ is equal to:
- A
$\bar{\text{x}}+\bar{\text{y}}$
- ✓
$\frac{\bar{\text{x}}+\bar{\text{y}}}{2}$
- C
$\frac{\bar{\text{x}}+\bar{\text{y}}}{\text{n}}$
- D
$\frac{\bar{\text{x}}+\bar{\text{y}}}{2\text{n}}$
AnswerCorrect option: B. $\frac{\bar{\text{x}}+\bar{\text{y}}}{2}$
We have $\bar{\text{x}}$ is the mean of $x_1, x_2, \ldots ., x_n$, and $\bar{y}$ is the mean of $y_1, y_2, \ldots, y_n$
So, $\bar{\text{x}}=\frac{(\text{x}_1+\text{x}_2+\text{x}_3+\ ....\ +\text{x}_\text{n})}{\text{n}}$
$\Rightarrow\text{x}_1+\text{x}_2+\text{x}_3+\ .....\ +\text{x}_\text{n}=\text{n}\bar{\text{x}}$
And $\bar{\text{y}}=\frac{(\text{y}_1+\text{y}_2+\text{y}_3+\ ....\ +\text{y}_\text{n})}{\text{n}}$
$\Rightarrow\text{y}_1+\text{y}_2+\text{y}_3+\ ....\ +\text{y}_\text{n}=\text{n}\bar{\text{y}}$
If $\bar{\text{z}}$ is the mean of $x_1, x_2, ...., y_1, y_2, , ... , y_n$
$\overline{ z }=\frac{ n \overline{ x }+ n \overline{ y }}{ n + n }=\frac{ n (\overline{ x }+\overline{ y })}{2 n }=\frac{\overline{ x }+\overline{ y }}{2}$
View full question & answer→MCQ 931 Mark
The difference between the upper and the lower class limits is called:
AnswerThe difference between the upper and the lower class limits is called the class size.
Hence, the correct choice is $(b).$
View full question & answer→MCQ 941 Mark
The mean of $a, b, c, d$ and e is $28.$ If the mean of $a, c,$ and e is $24$, What is the mean of $b$ and $d?$
Answer$\text{Mean}=\frac{\text{a}+\text{b}+\text{c}+\text{d}+\text{e}}{5}=28$
$⇒ a + b + c + d + e = 140 ...(1)$
Also, $\text{Mean}=\frac{\text{a}+\text{c}+\text{e}}{3}=24$
$⇒ a+ c + e = 72 ...(2)$
Subtracting equation $(2)$ from $(1),$ we have
$b + d = 68$
$\text{Mean}=\frac{\text{b}+\text{d}}{2}=\frac{68}{2}=34$
View full question & answer→MCQ 951 Mark
Write the correct answer in the following: The mean of $25$ observations is $36$. Out of these observations if the mean of first $13$ observations is $32$ and that of the last $13$ observations is $40$, the $13^{th}$ observation is:
AnswerMean of first $13$ observation $= 32$
$\therefore$ Sum of all first $13$ observation $= (32 \times 13) = 416$
Mean of last $13$ observation $= 40$
$\therefore$ Sum of all last $13$ observation $= (40 \times 13) = 520$
Mean of $25$ observation $= 36$
$\therefore$ Sum of all first $25$ observation $= (36 \times 25) = 900$
Hence, $13^{th}$ observation $= 416 + 520 - 900 = 36$
View full question & answer→MCQ 961 Mark
If each observation of the data is increased by $3,$ then their mean:
AnswerCorrect option: B. Is increased by $3.$
Since mean is equal to the sum of all the values in the data set divided by the number of values in the data set.
So increase in the value of each observation will also increase the mean (average) by $3.$
View full question & answer→MCQ 971 Mark
If $\text{x}$ represents the mean of observations $x_1, x_2 \ldots ., x_n, $ then value of $\displaystyle\sum_{\text{i=1}}^{\text{n}}\big(\text{x}_\text{i}-\text{x}\big)$ is.
AnswerSince mean is equal to the sum of all the values in the data set divided by the number of values in the data set also called as average.
Hence, sum of difference of all the numbers $\&$ mean value will be zero.
View full question & answer→MCQ 981 Mark
If $\bar{\text{x}}$ is the mean of $x_1, x_2, x_3, \ldots, x_n$ then $\sum\limits_{\text{i}=1}^\text{n}(\text{x}_\text{i}-\bar{\text{x}})=?$
AnswerGiven that $\bar{\text{x}}$ is the mean of $x_1, x_2, x_3, \ldots, x_n$
$\Rightarrow\frac{\text{x}_1+\text{x}_2+\text{x}_3+_{\dots}+\text{x}_\text{n}}{\text{n}}=\bar{\text{x}}$
$\Rightarrow\text{x}_1+\text{x}_2+\text{x}_3+_{\dots}+\text{x}_\text{n}=\text{n }\bar{\text{x}}\ \dots\text{(i)}$
Consider,
$\big(\text{x}_1-\bar{\text{x}}\big)+\big(\text{x}_2-\bar{\text{x}}\big)+\big(\text{x}-\bar{\text{x}}\big)+_{\dots}+\big(\text{x}_\text{n}-\bar{\text{x}}\big)$
$=\big(\text{x}_1+\text{x}_2+\text{x}_3+_{\dots}+\text{x}_\text{n}\big)-\text{n }\bar{\text{x}}$
$=\text{n}\bar{\text{x}}-\text{n}\bar{\text{x}}\ \dots($from $(i))$
$=0$
View full question & answer→MCQ 991 Mark
The median for the digits $1, 2, 3, … 9$ is:
AnswerThe median is the middle score for a set of data that has been arranged in ascending or descending order of magnitude.
So for numbers $1, 2, 3, ... 9$
$5$ is the median.
View full question & answer→MCQ 1001 Mark
The following is the data of wages per day $: 5, 4, 7, 5, 8, 8, 8, 5, 7, 9, 5, 7, 9, 10, 8$ The mode of the data is:
- A
$7$
- B
$5$
- C
$8$
- ✓
$(B)$ and $(C)$ both
AnswerCorrect option: D. $(B)$ and $(C)$ both
In data $5, 4, 7, 5, 8, 8, 8, 5, 7, 9, 5, 7, 9, 10, 8,$
We observe that values $5$ and $8$ both have maximum frequency i.e. $4$
View full question & answer→