MCQ 11 Mark
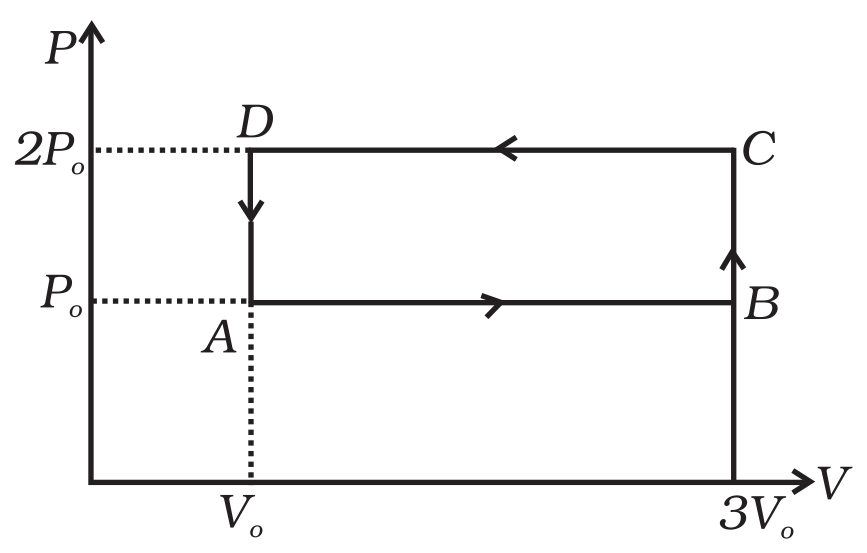
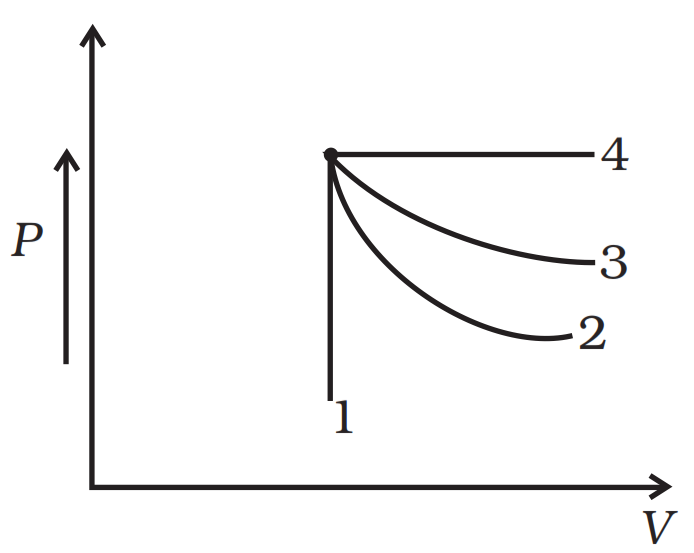
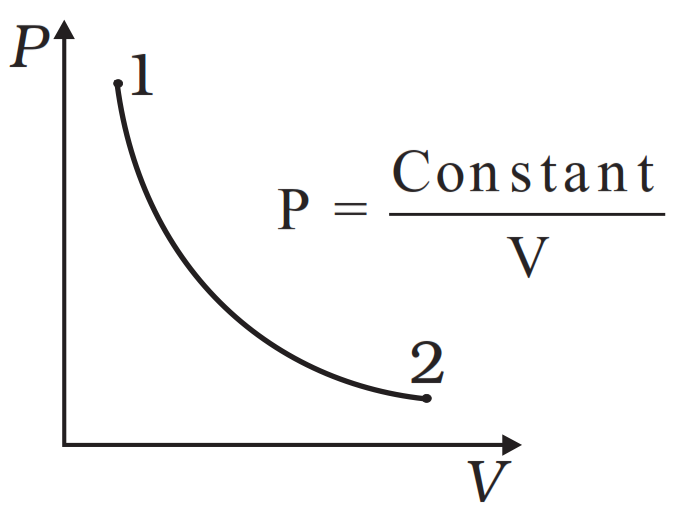
Consider $P-V$ diagram for an ideal gas shown in:
Out of the following diagrams which represents the $T-P$ diagram?
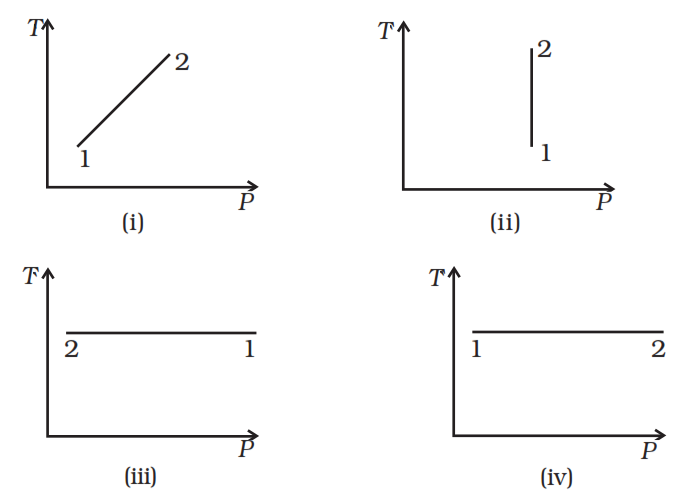
Out of the following diagrams which represents the $T-P$ diagram?
- A$(iv)$
- B$(ii)$
- ✓$(iii)$
- D$(i)$
Answer
View full question & answer→Correct option: C.
$(iii)$
According to $P-V$ diagram at constant tempreature, $P$ increase as V decrease. So, it is Boyei's law in option $(iii)$ and $(iv)$. If $P$ increase at constant tempreature, volume $V$ decrease. as in $(iii) T-P$ diagram, $P$ is smaller at $2$ and larger at $1$, which tallies with option $c$.