Sample QuestionsData Handling questions
One sample from each question group in this chapter. Select any group above to see the full set with answer keys.
The weights of $9$ apples are $50, 60, 65, 62, 67, 70, 64, 45, 48$ grams Their mean weight is:
- A
$60.5$ gram
- B
$60$ gram
- ✓
$59$ gram
- D
$62$ gram
Answer: C.
View full solution →Three years ago the average age of the family of $5$ members was $17$ years A baby having been born the average age of the family is the same today What is the baby today$?$
- A
$4$ years
- B
$3$ years
- ✓
$2$ years
- D
$1$ year
Answer: C.
View full solution →There are $7$ observations in the data and their mean is $11$. If each observation is multiplied by $2,$ then the mean of new observations is:
Answer: C.
View full solution →If the mean of $x$ and $\frac{1}{\text{x}}$ is $M,$ then the mean of $x^2$ and $\frac{1}{\text{x}{^{2}}}$ is:
- A
$M^2$
- B
$2M^2+ 1$
- ✓
$2M^2 -1$
- D
$\frac{\text{m}^{2}}{4}$
Answer: C.
View full solution →If the range of $14, 12, 17, 18, 16, x$ is $20$ and $x > 0,$ the value of $x$ is:
Answer: C.
View full solution →Directions: In the following questions, the Assertions $(A)$ and Reason$(s)$ $(R)$ have been put forward. Read both the statements carefully and choose the correct alternative from the following:
Assertion: The median of a set of data is the middlemost number in the set.
Reason: If $I < m < n$ then the median of the list $i, m, n$ is $n$.
- A
Both Assertion and Reason are correct and Reason is the correct explanation for Assertion.
- B
Both Assertion and Reason are correct and Reason is not the correct explanation for Assertion.
- ✓
Assertion is true but the reason is false.
- D
Both assertion and reason are false.
Answer: C.
View full solution →Directions: In the following questions, the Assertions $(A)$ and Reason$(s)$ $(R)$ have been put forward. Read both the statements carefully and choose the correct alternative from the following:
Assertion: Mean is one of the numbers in data.
Reason: The data $6, 4, 3, 8, 9, 12, 13, 9$ has mean $9$.
- A
Both Assertion and Reason are correct and Reason is the correct explanation for Assertion.
- B
Both Assertion and Reason are correct and Reason is not the correct explanation for Assertion.
- C
Assertion is true but the reason is false.
- ✓
Both assertion and reason are false.
Answer: D.
View full solution →Directions: In the following questions, the Assertions $(A)$ and Reason$(s)$ $(R)$ have been put forward. Read both the statements carefully and choose the correct alternative from the following:
Assertion: The median of the distribution $2, 3, 4, 7, 5, 1, 6$ is $4$.
Reason: The middle most observation of a data series is called the median of the series.
- ✓
Both Assertion and Reason are correct and Reason is the correct explanation for Assertion.
- B
Both Assertion and Reason are correct and Reason is not the correct explanation for Assertion.
- C
Assertion is true but the reason is false.
- D
Both assertion and reason are false.
Answer: A.
View full solution →Directions: In the following questions, the Assertions $(A)$ and Reason$(s)$ $(R)$ have been put forward. Read both the statements carefully and choose the correct alternative from the following:
Assertion: Mode is the term which appears maximum number of times.
Reason: Mode of $2, 3, 4, 5, 0, 1, 3, 3, 4, 3$ is $3.$
- ✓
Both Assertion and Reason are correct and Reason is the correct explanation for Assertion.
- B
Both Assertion and Reason are correct and Reason is not the correct explanation for Assertion.
- C
Assertion is true but the reason is false.
- D
Both assertion and reason are false.
Answer: A.
View full solution →Directions: In the following questions, the Assertions $(A)$ and Reason$(s)$ $(R)$ have been put forward. Read both the statements carefully and choose the correct alternative from the following:
Assertion: Mode is a simple and popular average.
Reason: Mode is the possible value of the distribution.
- A
Both Assertion and Reason are correct and Reason is the correct explanation for Assertion.
- ✓
Both Assertion and Reason are correct and Reason is not the correct explanation for Assertion.
- C
Assertion is true but the reason is false.
- D
Both assertion and reason are false.
Answer: B.
View full solution →The median of numbers on a die is $4$.
View full solution →An arithmetic mean of a set of observations is greater than its average.
The arithmetic mean of first five natural numbers is $3$.
View full solution →The difference between the highest and the lowest observation gives an idea of the spread of the observations.
Mean may be bigger than each of the observations.
The mode of a data having observations $1. 2. 3. 1. 2. 1. 2. 1$ is
View full solution →The probability of getting a black ball from a bag containing $4$ black and $2$ red balls is…………. $\left(\frac{2}{3}, \frac{3}{2}, \frac{1}{2}\right)$
View full solution →A batsman scored $15$ runs in an over. He scored average……….. runs on each ball. $(6, 5, 2.5)$
View full solution →In a throw of a die, the probability of getting $3$ is…………. $\left(\frac{1}{2}, \frac{1}{3}, \frac{1}{6}\right)$
View full solution →The sum of five observations in a data is $40$. then mean of the data is $…………. (5. 40. 8) )$
View full solution →Read the bar graph (Fig) which shows the number of books sold by a bookstore during five consecutive years and answer the question: Can you explain how you would estimate the number of books sold in $1989?$

View full solution →Read the bar graph (Fig) which shows the number of books sold by a bookstore during five consecutive years and answer the question: In which years were fewer than $250$ books sold?

View full solution →Read the bar graph (Fig) which shows the number of books sold by a bookstore during five consecutive years and answer the question: In which year about $475$ books were sold? About $225$ books sold?
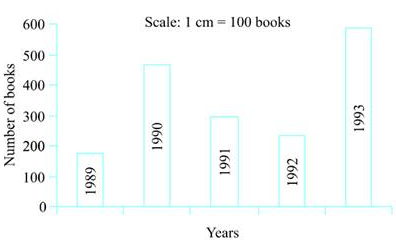
View full solution →Read the bar graph (Fig) which shows the number of books sold by a bookstore during five consecutive years and answer the question: About how many books were sold in $1989? 1990? 1992?$

View full solution →The data $6, 4, 3, 8, 9, 12, 13, 9$ has mean $9.$
View full solution →Use the bar graph to answer the question: How many students have dog as a pet?
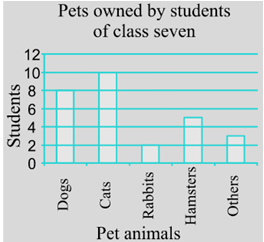
Use the bar graph to answer the question: Which is the most popular pet?

Find the mode and median of the data :$13, 16, 12, 14, 19, 12, 14, 13, 14.$
View full solution →The scores in mathematics test (out of $25$) of $15$ students is as follows :$19, 25, 23, 20, 9, 20, 15, 10, 5, 16, 25, 20, 24, 12, 20$. Find the mode and median of this data. Are they same?
View full solution →The enrolment of a school during six consecutive years was as follows: $1555, 1670, 1750, 2013, 2540, 2820$. Find the mean enrolment of the school for this period.
View full solution →Take the data giving the minimum and the maximum temperature of various cities given in Table. Plot a double bar graph using the data and answer the question: Name the city which has the least difference between its minimum and the maximum temperature.
| Temperatures of Cities as on $20.6.2006$ |
| City |
Max. |
Min. |
| Ahmedabad |
$38^{\circ} \mathrm{C}$ |
$29^{\circ} \mathrm{C}$ |
| Amritsar |
$37^{\circ} \mathrm{C}$ |
$26^{\circ} \mathrm{C}$ |
| Banglore |
$28^{\circ} \mathrm{C}$ |
$21^{\circ} \mathrm{C}$ |
| Chennai |
$36^{\circ} \mathrm{C}$ |
$27^{\circ} \mathrm{C}$ |
| Delhi |
$38^{\circ} \mathrm{C}$ |
$28^{\circ} \mathrm{C}$ |
| Jaipur |
$39^{\circ} \mathrm{C}$ |
$28^{\circ} \mathrm{C}$ |
| Jammu |
$41^{\circ} \mathrm{C}$ |
$26^{\circ} \mathrm{C}$ |
| Mumbai |
$32^{\circ} \mathrm{C}$ |
$27^{\circ} \mathrm{C}$ |
View full solution →Take the data giving the minimum and the maximum temperature of various cities given in Table. Plot a double bar graph using the data and answer the question: Name two cities where maximum temperature of one was less than the minimum temperature of the other.
| Temperatures of Cities as on $20.6.2006$ |
| City |
Max. |
Min. |
| Ahmedabad |
$38^{\circ} \mathrm{C}$ |
$29^{\circ} \mathrm{C}$ |
| Amritsar |
$37^{\circ} \mathrm{C}$ |
$26^{\circ} \mathrm{C}$ |
| Banglore |
$28^{\circ} \mathrm{C}$ |
$21^{\circ} \mathrm{C}$ |
| Chennai |
$36^{\circ} \mathrm{C}$ |
$27^{\circ} \mathrm{C}$ |
| Delhi |
$38^{\circ} \mathrm{C}$ |
$28^{\circ} \mathrm{C}$ |
| Jaipur |
$39^{\circ} \mathrm{C}$ |
$28^{\circ} \mathrm{C}$ |
| Jammu |
$41^{\circ} \mathrm{C}$ |
$26^{\circ} \mathrm{C}$ |
| Mumbai |
$32^{\circ} \mathrm{C}$ |
$27^{\circ} \mathrm{C}$ |
View full solution →Take the data giving the minimum and the maximum temperature of various cities given in Table. Plot a double bar graph using the data and answer the question: Which is the hottest city and which is the coldest city?
| Temperatures of Cities as on $20.6.2006$ |
| City |
Max. |
Min. |
| Ahmedabad |
$38^{\circ} \mathrm{C}$ |
$29^{\circ} \mathrm{C}$ |
| Amritsar |
$37^{\circ} \mathrm{C}$ |
$26^{\circ} \mathrm{C}$ |
| Banglore |
$28^{\circ} \mathrm{C}$ |
$21^{\circ} \mathrm{C}$ |
| Chennai |
$36^{\circ} \mathrm{C}$ |
$27^{\circ} \mathrm{C}$ |
| Delhi |
$38^{\circ} \mathrm{C}$ |
$28^{\circ} \mathrm{C}$ |
| Jaipur |
$39^{\circ} \mathrm{C}$ |
$28^{\circ} \mathrm{C}$ |
| Jammu |
$41^{\circ} \mathrm{C}$ |
$26^{\circ} \mathrm{C}$ |
| Mumbai |
$32^{\circ} \mathrm{C}$ |
$27^{\circ} \mathrm{C}$ |
View full solution →Take the data giving the minimum and the maximum temperature of various cities given in Table. Plot a double bar graph using the data and answer the question: Which city has the largest difference in the minimum and maximum temperature on the given date?
| Temperatures of Cities as on $20.6.2006$ |
| City |
Max. |
Min. |
| Ahmedabad |
$38^{\circ} \mathrm{C}$ |
$29^{\circ} \mathrm{C}$ |
| Amritsar |
$37^{\circ} \mathrm{C}$ |
$26^{\circ} \mathrm{C}$ |
| Banglore |
$28^{\circ} \mathrm{C}$ |
$21^{\circ} \mathrm{C}$ |
| Chennai |
$36^{\circ} \mathrm{C}$ |
$27^{\circ} \mathrm{C}$ |
| Delhi |
$38^{\circ} \mathrm{C}$ |
$28^{\circ} \mathrm{C}$ |
| Jaipur |
$39^{\circ} \mathrm{C}$ |
$28^{\circ} \mathrm{C}$ |
| Jammu |
$41^{\circ} \mathrm{C}$ |
$26^{\circ} \mathrm{C}$ |
| Mumbai |
$32^{\circ} \mathrm{C}$ |
$27^{\circ} \mathrm{C}$ |
View full solution →Consider this data collected from a survey of a colony.
| Favourite Sport |
Cricket |
Basket Ball |
Swimming |
Hockey |
Athletics |
| Watching |
$1240$ |
$470$ |
$510$ |
$423$ |
$250$ |
| Participating |
$620$ |
$320$ |
$320$ |
$250$ |
$105$ |
Which is more preferred, watching or participating in sports? View full solution →During the $HC$ game, players can spin the wheel to earn points.
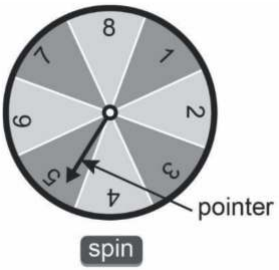
$1.$ What is the probability that she earns $6$ points$?$ - A
$0$
- B
$\frac{1}{12}$
- C
$\frac{1}{5}$
- ✓
$\frac{1}{2}$
Answer: D.
View full solution →The graph below shows the percentage of new and existing active users of the games.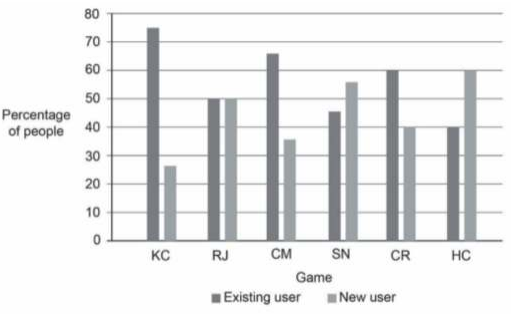
$1.$ In which game the number of existing active users is more than $1.5$ million$?$
$A. KC$
$B. RJ$
$C. CM$
$D. CR$
$2. $ For which game(s) the number of new users is more than the number of existing users$?$
$3.$ It has been observed that $50\%$ of the new $RJ$ game users play online with friends.
For existing users, this percentage is $36\%.$
What is the number of people (in millions) playing $RJ $ game online with friends$?$
$A. 1.39$ millions
$B. 4.975$ millions
$C. 8.557$ millions
$D. 9.95$ millions
$4.$ Mary played $10\ HC$ matches. She scored $45, 36, 50, 27, 36, 52, 50, 43, 50$ and $47$ points in them. What is the most frequent score point$?$
$A. 27$
$B. 36$
$C. 47$
$D. 50$
$5. $ Are the mean and median of Mary’s scores equal? Justify your answer.
$6.$ Mary scored 56 points in her $11th$ match. What is the change in her mean score after the $11th$ match$?$
$A.$ Increases by $1.13$
$B.$ Increases by $5.6$
$C.$ Decreases by $4$
$D.$ Decreases by $3$
$7.$ What is the probability of Mary scoring $60$ points in her $12th$ match$?$
The highest score in the match is $60$ points.
$A. 0$
$B. \frac{1}{12}$
$C.\frac{1}{5}$
$D. \frac{1}{2}$ View full solution →Gaming apps allow users to download and play games in online or ofline mode. A play store data
shows $20$ million downloads of $6$ popular games. The table below shows the number of daily active users of the games:
| Game |
Active users (in millions) |
| $KC$ |
$2.07$ |
| $RJ$ |
$1.99$ |
| $CM$ |
$1.82$ |
| $SN$ |
$1.56$ |
| $CR$ |
$1.34$ |
| $HC$ |
$1.20$ |
$1.$ Around $50\%$ of those who downloaded the games are active users.
Is the statement correct? Give reason to justify your answer.
$2.$ Every fourth person who downloaded the games spends more than an hour a day playing them.
What percentage of active players play more than an hour a day? View full solution →The weights (in kg.) of $15$ students of a class are $:38, 42, 35, 37, 45, 50, 32, 43, 43, 40, 36, 38, 43, 38, 47. (i) $ Find the mode and median of this data.$(ii)$ Is there more than one mode$ ?$
View full solution →The runs scored in a cricket match by $11$ players is as follows: $6, 15, 120, 50, 100, 80, 10, 15, 8, 10, 15.$ Find the mean, mode and median of this data. Are the three same$?$
View full solution →The margins of victory in the football matches of a league are:
$1, 3, 2, 5, 1, 4, 6, 2, 5, 2, 2, 2, 4, 1, 2, 3, 1, 1, 2, 3, 2, 6, 4, 3, 2, 1, 1, 4, 2, 1, 5, 3, 3, 2, 3, 2, 4, 2, 1, 2$
Find the mode of this data.
View full solution →