Question 15 Marks
Information regarding the annual expense on different particulars of two middle class families is given below. Draw a pic diagram for the data.
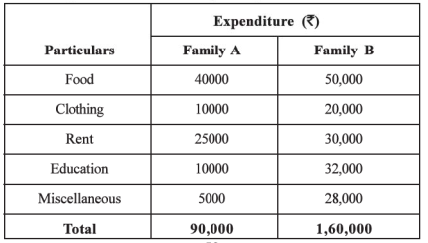
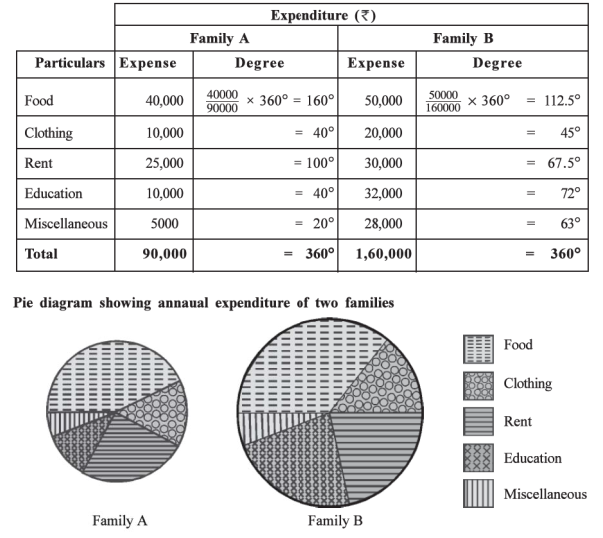
AnswerWe shall draw two circles for two families with radii proportional to the square root of the total expenditure of two families.
By taking total expenditure as $360^{\circ}$ the measures of angles of sub-data are obtained in terms of degrees.
Radius for family $A=\frac{\sqrt{90000}}{100}=\frac{300}{100}=3 \mathrm{~cm}$
Radius for family $B=\frac{\sqrt{160000}}{100}=\frac{400}{100}=4 \mathrm{~cm}$
View full question & answer→Question 25 Marks
The information regarding the production (in lakh ?) and sales (in lakh $T$) for a factory during five years is given below. Present it in a suitable diagram.
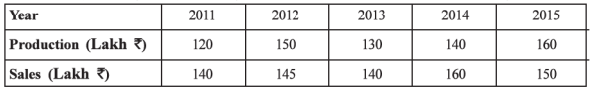
AnswerYear wise data regarding the production and sales for a factory are given here.
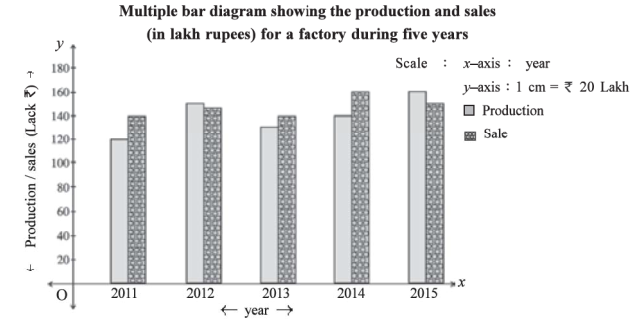
So, we draw multiple bar diagram by taking years on $x$ — axis and productionfsales (in lakh ?) on $y$ — axis. The diagram is as follows :
View full question & answer→Question 35 Marks
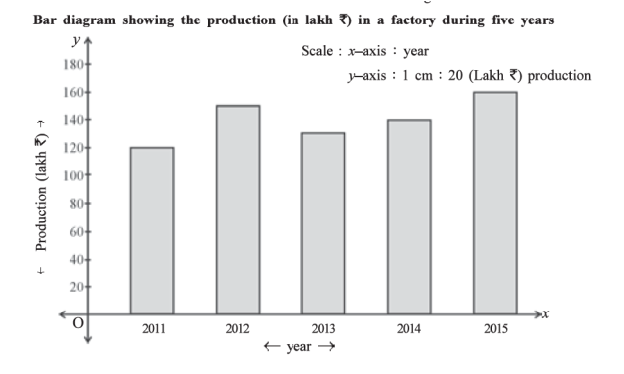
The information regarding the production (in lakh ?) in a factory during five years is given below. Present it in a suitable diagram.
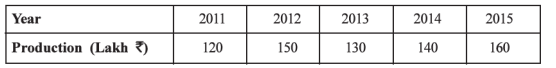
AnswerAs the attirbute (production) dependent on time is to be shown on the graph, we will draw bar diagram. By taking year on $x$-axis and production (in lakh $2$’) on $y$-axis, the bar diagram is as under :
View full question & answer→Question 45 Marks
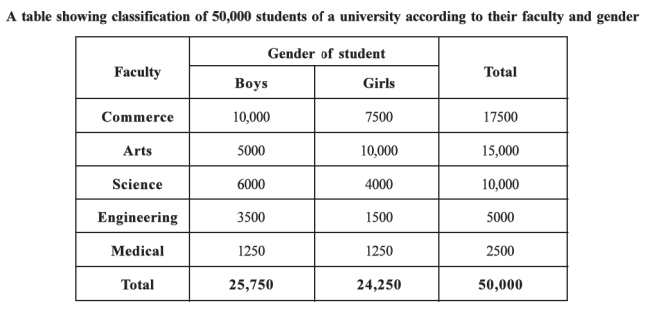
In a university, out of total $50,000$ students, $35\%$ are in commerce faculty, $30\%$ are in arts faculty, $20\%$ are in science faculty, $10\%$ are in engineering faculty and remain- ing $5$"/u are in medical faculty. The ratio of number of boys and girls in commerce faculty is $4:3$. ln arts faculty, the number of girls is double than that of boys. In science and engineering faculty, there are $60\%$ and $70\%$ boys respectively and in medical faculty, boys and girls are in equal numbers.
AnswerRepresent the above data in appropriate table.
The given attributes are $(i)$ faculty of students $(ii)$ gender of students.
Number of students in commerce faculty $=50000 \times \frac{35}{100}=17500$
The number of boys $=\frac{4}{4+3} \times 17500=10000$
The number of girls $=\frac{3}{4+3} \times 17500=7500$
Number of students in arts faculty $=50000 \times \frac{30}{100}=15000$
The number of girls are double than that of boys. If number of boys $=x$ then the number of girls $=2 x$
and $x+2 x=15000$
$\therefore \quad x=5000$
$\therefore$ Number of boys in arts faculty $=5000$ and number of girls $=10000$
Number of students in science faculty $=50000 \times \frac{20}{100}=10000$
The number of boys $=10000 \times \frac{60}{100}=6000$
$\therefore \quad$ The number of girls $=10000-6000=4000$
Number of students in engineering faculty $=50000 \times \frac{10}{100}=5000$
The number of boys $=5000 \times \frac{70}{100}=3500$
$\therefore \quad$ The number of girls $=5000 \times \frac{30}{100}=1500$
Number of students in medical faculty $=50000 \times \frac{5}{100}=2500$
The number of boys $=\frac{2500}{2}=1250$
and the number of girls $=\frac{2500}{2}=1250$
View full question & answer→Question 55 Marks
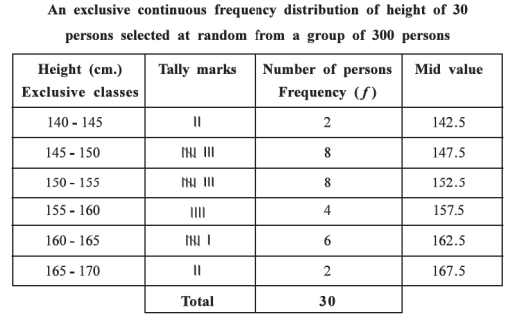
Out of $300$ persons residing in a region, a sample of $30$ persons is selected at random and the heights (in $cm$.) of these selected persons are as under :
$\text{163 148 151 162 145 152 149 158 153 149 150 152 145 141 162 168 148 158 149 141 146 155 159 150 161 153 162 160 154 165}$
$(i)$ Distribute these data into $6$ classes and also find the mid value of each class.
$(ii)$ Obtain ‘less than’ type cumulative frequency distribution.
$(iii)$ What is the percentage of persons having height less than $155 \ cm.$?
$(iv)$ Obtain ‘more than’ type cumulative frequency distribution.
$(v)$ How many persons have the height between $147$ to $157 \ cm.$?
Answer(i) 'Height of a person' is a continuous variable.
$ \text { Range of data } R= 168-141$
$ =27 $
Number of classes $K=6$
Class interval $C=\frac{R}{K}=4.5=5$
(ii) 'less than” type cumulative frequency distribution of heights of 30 persons selected at random from a group of 300 persons is as under :
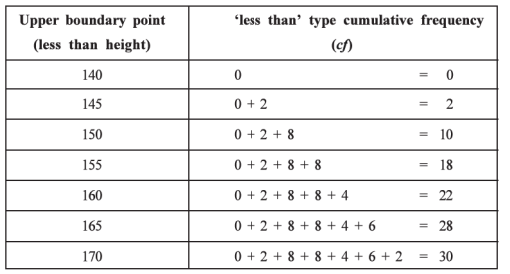
(iii) From the above table, it is clear that the number of persons having height less than $155 \mathrm{~cm} .=18$
$\therefore$ the percentage of persons $=\frac{18}{30} \times 100=60 \%$
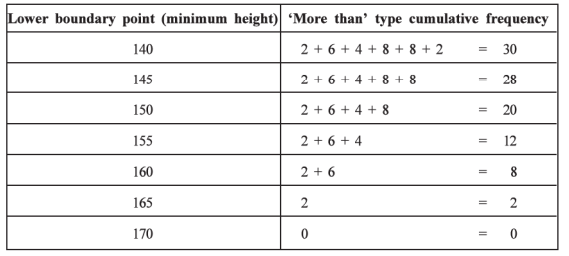
(iv) ‘More than“ type cumulative frequency distribution can be obtained as under :
$(v)$ To determine the number of persons having height $147$ to $157 \mathrm{~cm}$., we will use the original frequency distribution. $147$ is included in the class $145-150$, which has frequency $8$ .
Thus, when the class length is $5(145-150)$ then frequency is $8$ .
When the class length is $3(147-150)$ then the frequency is $\frac{3}{5} \times 8=4.8$
The frequency of the class $150-155$ is $8$ and the frequency for the class $155-157$ can be calculated as follows:
When the class length is $5(155-160)$ then frequency is $4$
$\therefore \quad$ When the class length is $2(155-157)$ then the frequency is $=\frac{2}{5} \times 4=1.6$
$\therefore \quad$ the total number of persons having height $147 $to $157 \mathrm{~cm} .=4.8+8+1.6=14.4 \approx 14$
Note : If we count the number of persons having height between $147$ and $157 \ cm$. from the given ungrouped data, we find $15$ persons. But according to above calculation, it is $14$. The obvious reason for this difference is, by classification into continuous frequency distribution, approximate values are used instead of the original raw data. View full question & answer→Question 65 Marks
The students of a university were Classified according to faculty and gender. $60\%$ of total $40,000$ students were boys. The number of girls in engineering faculty was three times the number of girls in commerce faculty. $15\%$ and $10\%$ of the total number of university students were boys and girls respectively who belonged to medical faculty. $20\%$ of the total number of students in the university belonged to faculty of Science and among these students, the number of girls were one - seventh of the number of boys. $7\%$ and $17\%$ of the total number of students of arts faculty were boys and girls respectively. $3.75 \%$ of the total number of students of the university belonged to the commerce faculty and the proportion of boys and girls among them was $3 : 7$. Present the above data in an appropriate table.
AnswerIn the given data two attributes are :
$(1)$ Faculty : Engineering, Medical, Science, Art, Commerce
$(2)$ Sex: Boys, Girls
According to these two attributes table is prepared as follows :
Table showing the number of students
of a university according to their
faculties and sex
| Faculty |
Sex |
Total no. of students |
| Boys |
Girls |
| Engineering |
$7750$ |
$3150$ |
$10900$ |
| Medical |
$6000$ |
$4000$ |
$10000$ |
| Science |
$7000$ |
$1000$ |
$8000$ |
| Arts |
$2800$ |
$6800$ |
$9600$ |
| Commerce |
$450$ |
$1050$ |
$1500$ |
| Total no. of students |
$24000$ |
$16000$ |
$40000$ |
View full question & answer→Question 75 Marks
Owner of a factory has decided to Produce $50$ mixers used as household equipment, but the daily production of mixers changes due to variation in the number of workers. A variation in production of mixers with respect to a pre-decided number of Production ($100$ units) during $40$ days is recorded as under. Prepare an exclusive continuous frequency distribution having class length 6 and mid value of one of the classes as $3$. Also prepare ‘less than’ and ‘more than’ cumulative frequency distributions.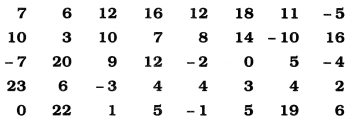
AnswerIn the given data, the minimum value of change in the production of mixers is $-10$ and maximum value is $23$.
Class length $= 6$ and mid value of one class $= 3$ are given.
Therefore lower limit of that class $= 3$ $-$ $=$ $3 – 3 = 0$ and upper limit of that class $= 3$ $+$
  $= 3 + 3 = 6$
- Thus, given class is $0 - 6$. Therefore the initial class in the frequency distribution that includes the minimum value $-10$ is $-12$ to $- 6$ and the last class that includes the maximum value $23$ is $18$ to $24.$
- The frequency distribution is obtained as follows :
Exclusive continuous frequency distribution showing the change in the production of mixers during $40$ days
| Change in the production of mixers |
Tally marks |
No. of days
$f$ |
| $-12$ to $-6$ |
 |
$2$ |
| $-6$ to $0$ |
 |
$5$ |
| $0$ to $6$ |
 |
$12$ |
| $6$ to $12$ |
 |
$10$ |
| $12$ to $18$ |
 |
$6$ |
| $18$ to $24$ |
|
$5$ |
| Total |
- |
$n = 40$ |
‘Less than’ type cumulative frequency distribution
| Less than upper boundary point |
Cumulative frequency of $cf$ |
| $-12$ |
$0 =0$ |
| $-6$ |
$0 + 2 = 2$ |
| $0$ |
$2 + 5 = 7$ |
| $6$ |
$7 + 12 = 19$ |
| $12$ |
$19 + 10 =29$ |
| $18$ |
$29 + 6 = 35$ |
| $24$ |
$35 + 5 = 40$ |
‘More than’ type cumulative frequency distribution
| Equal to or more than lower boundary point |
Cumulative frequency of $cf$ |
| $-12$ |
$40 = 40$ |
| $-6$ |
$40 -2 = 38$ |
| $0$ |
$38-5 = 33$ |
| $6$ |
$33 -12 = 21$ |
| $12$ |
$21 – 10 =11$ |
| $18$ |
$11 -6 = 5$ |
| $24$ |
$5- 5 = 0$ |
View full question & answer→Question 85 Marks
A sample of $25$ lenses is selected from a day’s production of a company manufacturing eye lenses. The thicknesses (in millimeter) of these selected lenses are as under. Distribute these data into five classes of equal length.
$1.518, 1.509, 1.527, 1.505, 1.520,$
$1.511, 1.518, 1.522, 1.528, 1.528,$
$1.520, 1.520, 1.514, 1.508, 1.525,$
$1.506, 1.519, 1.523, 1.521, 1.517,$
$1.514, 1.515, 1.516, 1.521, 1.507$
If the company decides that the lenses having thicknesses less than $1.510$ and more than $1.525$ are considered as defective then what per cent of lenses in the sample are defective ?
AnswerIn the given data :
minimum thickness of lens $= 1.505$ mm and
maximum thickness of lens $= 1.528$ mm.
$\therefore$ Range $=1.528-1.505=0.023$
In 5 classes the data is to be distributed.
$\therefore$ Class length $=\frac{0.023}{5}=0.0046 \approx 0.005$
- Therefore the initial class that includes minimum value $1.505$ is $1.505$ to $1.510$ and the last class that includes maximum value $1.528$ is $1.525$ to $1.530.$
- The frequency distribution is obtained as follows :
Exclusive continuous frequency distribution of thickness of eye lenses
| Thickness of lens (mm) |
Tally marks |
No. of lenses $f$ |
| $1.505 – 1.510$ |
 |
$5$ |
| $1.510 -1.515$ |
 |
$3$ |
| $1.515 -1.520$ |
 |
$6$ |
| $1.520 -1.525$ |
 |
$7$ |
| $1.525 – 1.530$ |
 |
$4$ |
| Total |
- |
$n = 25$ |
- In the above frequency distribution the number of lenses of thickness less than $1.510 mm=5$ and the number of lenses of thickness equal to or more than $1.525$ mm is $4.$
- Therefore total $(5 + 4 =)9$ lenses are defective.
$\therefore$ The percentage of defective lenses in the Sample $=\frac{9}{25} \times 100=36 \%$ View full question & answer→Question 95 Marks
Represent the following information by a pictogram:
|
Year
|
$2010$ |
$2011$ |
$2012$ |
$2013$ |
$2014$ |
|
Production of mangoes (kg.)
|
$1,00,000$ |
$1,50,000$ |
$2,50,000$ |
$1,50,000$ |
$75,000$ |
View full question & answer→Question 105 Marks
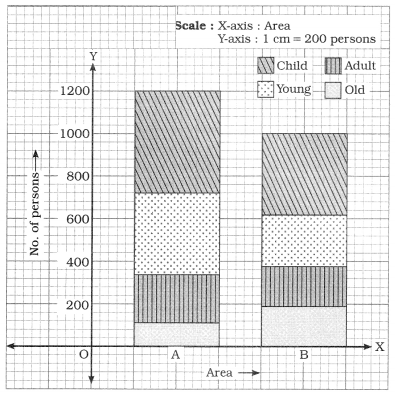
Information regarding the age of persons living in two different regions is as under. Present it by using an appopriate diagram.
| Age |
Less than $15$ (Child) |
$15$ to $35$ (Young) |
$35$ to $60$ (Adult) |
More than $60$ (Old) |
Total |
| Region $A$ |
$480$ |
$360$ |
$240$ |
$120$ |
$1200$ |
| Region $B$ |
$350$ |
$250$ |
$200$ |
$200$ |
$1000$ |
View full question & answer→Question 115 Marks
Information regarding the age of persons living in two different regions is as under. Present it by using an appopriate diagram.
| Age |
Less than $15$ (Child) |
$15$ to $35$ (Young) |
$35$ to $60$ (Adult) |
More than $60$ (Old) |
Total |
| Region $A$ |
$480$ |
$360$ |
$240$ |
$120$ |
$1200$ |
| Region $B$ |
$350$ |
$250$ |
$200$ |
$200$ |
$1000$ |
AnswerThe data on different age group is to be represented. Therefore, divided bar diagram is drawn.
We prepare the following table showing the dividing line for different section of age in each bar :
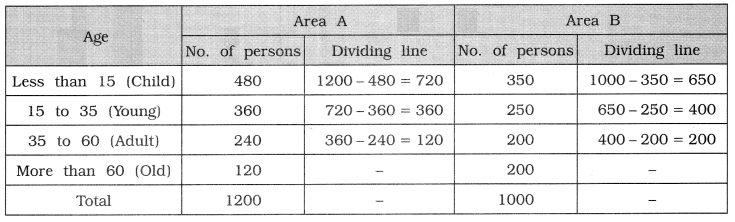
In figure, Area $A$ and Area $B$ are shown on $X$-axis. Bars are drawn taking appropriate width and length proportional to number of persons, taking scale $1 \ cm = 200$ persons on $Y$-axis.
Divided bar diagram showing the age of persons reading in different two areas
View full question & answer→Question 125 Marks
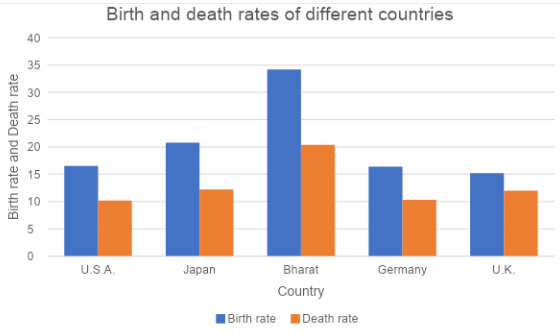
Information regarding the birth rate and death rate of $5$ countries is as under. Present it by a suitable diagram.
| Country |
$U.S.A.$ |
Japan |
Bharat |
Germany |
$U.K.$ |
| Birth rate |
$16.5$ |
$20.8$ |
$34.2$ |
$16.4$ |
$15.2$ |
| Death rate |
$10.2$ |
$12.2$ |
$20.4$ |
$10.3$ |
$12.0$ |
AnswerIn the given data, there are two variable characteristics: Birth rate and death rate of different countries.
Therefore, multiple bar diagram is an appropriate diagram. Here, different countries are shown on $X$-axis.
Birth rate and death rate are shown on $Y$-axis taking scale $1 \ cm = 5$ units.
Drawing the multiple bars for birth rate and death rate, the multiple bar, diagram is prepared.
Multiple bar diagram showing the birth rate and death rate of different five countries during a year
View full question & answer→Question 135 Marks
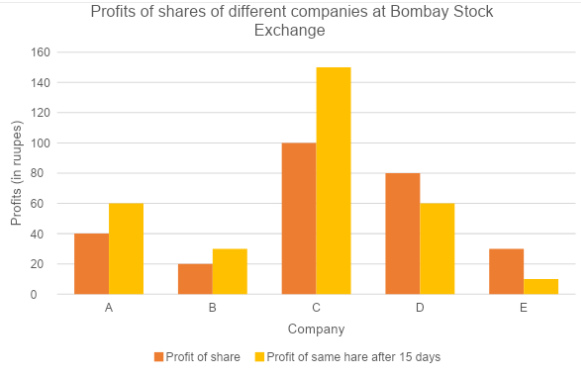
Changes in the price of share of $5$ companies at Bombay Stock Exchange during an interval of $15$ days are as follows. Present them by a suitable diagram:
| Company |
$A$ |
$B$ |
$C$ |
$D$ |
$E$ |
| Price of share $(₹)$ |
$40$ |
$20$ |
$100$ |
$80$ |
$30$ |
| Price of same share after $15$ days $(₹)$ |
$60$ |
$30$ |
$150$ |
$60$ |
$10$ |
AnswerHere, companies are shown on $X$-axis. Closing price of share and closing price of share after $15$ days are shown on $Y$-axis taking scale $1 \ cm = ?\ 20$ and drawing multiple bars for two different variable characteristics for each company, multiple bar diagram is prepared as in figure. Multiple bar diagram showing the closing price of shares of different five companies of Mumbai Stock Exchange
View full question & answer→Question 145 Marks
The data on the profit of a company is as under. Present it by an appropriate diagram:
| Year |
$2010$ |
$2011$ |
$2012$ |
$2013$ |
$2014$ |
$2015$ |
| Profit (crore $₹$) |
$10$ |
$5$ |
$-2$ |
$4$ |
$8$ |
$6$ |
View full question & answer→Question 155 Marks
Details of production of electric bulb by two well-known companies are as under. Represent them by a pictogram.
| Year |
Production of electric bulbs (in lac units) |
| Company $A$ |
Company $B$ |
| $2012$ |
$50$ |
$100$ |
| $2013$ |
$100$ |
$150$ |
| $2014$ |
$175$ |
$200$ |
| $2015$ |
$200$ |
$200$ |
View full question & answer→Question 165 Marks
Obtain an inclusive continuous frequency distribution from the following data :
| Lower Boundary Point or more |
$44.5$ |
$49.5$ |
$54.5$ |
$59.5$ |
$64.5$ |
$69.5$ |
$74.5$ |
$79.5$ |
- |
| Cumulative Frequency |
$500$ |
$470$ |
$390$ |
$290$ |
$240$ |
$90$ |
$10$ |
$0$ |
- |
AnswerGiven data is ‘more than’ type cumulative frequency distribution.
$\therefore $ Class length $=$ Difference between the adjoining lower boundary points $= 54.5 – 49.5 = 5$
Now, upper boundary point of the class $=$ lower boundary point $+$ class length
For initial class lower boundary point $= 44.5$
$\therefore $ initial class is $44.5 – 49.5$.
For inclusive continuous frequency distribution lower limit of initial class $= 44.5 + 0.5 = 45$ and
upper limit of initial class $= 49.5 – 0.5 = 49.$
Thus, for given data the initial class in inclusive form, we get $45-49.$
In this manner, we will obtain the class for each lower boundary point.
We will find the frequency of each class from the given ‘more than’ cumulative frequency as follows :
Frequency of a class $= \ ($‘more than’ cumulative frequency of a class$) \ – \ ($‘more than cumulative frequency of immediate following class$)$
Frequency of class for $44.5 = ($‘more than’ cumulative frequency of a class for $44.5) \ – \ ($‘more than cumulative frequency of immediate following class for $49.5)$
$= (500 – 470) = 30$
In this manner we will obtain the frequency for the rest of classes.
For the given data, we get the inclusive continuous frequency distribution as follows :
| Lower Boundrary Point or more |
More then cumulative frequency $CF$ |
class |
Frequency $f$ |
| $44.5$ |
$500$ |
$45-49$ |
$500-470=30$ |
| $49.5$ |
$470$ |
$50-54$ |
$470-390=80$ |
| $54.5$ |
$390$ |
$55-59$ |
$390-290=100$ |
| $59.5$ |
$290$ |
$60-64$ |
$290-240=50$ |
| $64.5$ |
$240$ |
$65-69$ |
$240-90=150$ |
| $69.5$ |
$90$ |
$70-74$ |
$90-10=80$ |
| $74.5$ |
$10$ |
$75-79$ |
$10-0=10$ |
| $79.5$ |
$0$ |
$80-84$ |
$=0$ |
| - |
- |
Total |
$n=500$ |
View full question & answer→Question 175 Marks
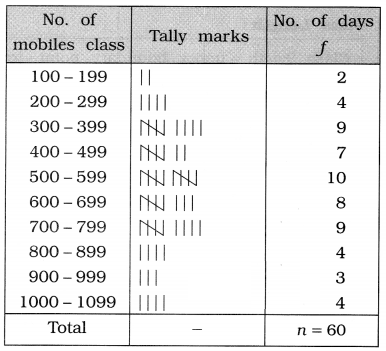
The data regarding the number of mobile phones produced during last $60$ days by a mobile phone manufacturing company is given below. Distribute it into $10$ classes.
Obtain ‘less than’ and ‘more than’ type cumulative frequency distribution from it. AnswerIn the given data, the minimum production of mobile is $188$ and the maximum is $1075$.
Therefore, range of data $R = 1075 – 188 = 887$ mobiles. The data is to be divided in $10$ classes.
Therefore, $k = 10$ range Now, class length $\mathrm{c}=\frac{\text { range }}{\text { no. of classes }}=\frac{\mathrm{R}}{k}$
$\therefore \mathrm{c}=\frac{887}{10}=88.7 \approx 89$
If $c = 89$, then $ck = 89 \times 10 = 890$, which is greater than $R$, i.e., $ck > R$. Hence, we can take $c = 89$. But, usually the value of $c$ should be taken which is multiple of $10$. Hence, $c = 100$ is taken.
Here, the range of data is large. Hence, it is advisable to prepare inclusive frequency distribution, $c = 100$. therefore the initial class which includes the lowest observation $188$ will be $100-199$ and the last class which includes the highest observation $1075$ will be $1000-1099$. Thus, inclusive continuous frequency distribution is obtained as follows :
Inclusive continuous frequency distribution, showing the production of mobiles during $60$ days
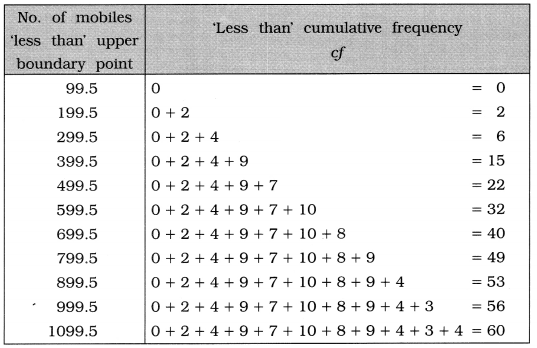
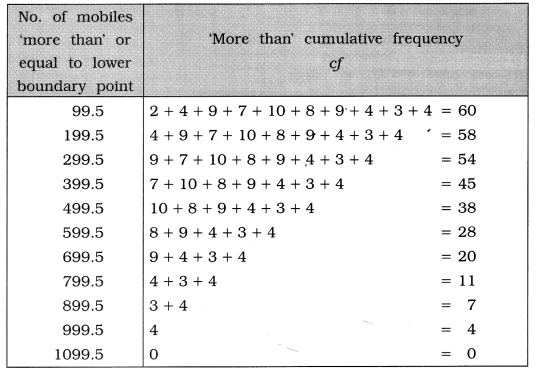
Explanation: For ‘less than’ and ‘more than’, cumulative frequency distribution, we have to obtain upper class boundary point and lower class boundary point of the classes respectively. For initial class $100-199,$
Lower class boundary point $=\frac{99+100}{2}=99.5$;
Upper class boundary point $\left.=\frac{199+200}{2}=199.5\right]$
[Alternative method: The upper limit of the class $100-199$ is $199$ and the lower limit of immediate class $200-299$ is $200$ . So their difference is $(200-199=)$ $1$.Dividing this difference by $2$ , we get $\left(\frac{1}{2}=\right) 0.5$.Subtracting this difference from the lower limit of each class and adding it to the upper limit of each class,we get lower boundary point and upper boundary point respectively for each class.]
Less than type cumulative frequency distribution
‘More than’ type cumulative frequency distribution
View full question & answer→Question 185 Marks
The data on retail price of a commodity for $50$ days are as follows. Classify the data iaking class length $1$ and the mid value of initial class $12.5$ into an appropriate continuous frequency distribution. (Price is per $kg$ in ).
$\text{13.25,14.20,13.75,14.10,14.00,12.85,13.40,14.20,15.30$, $15.40,16.10,15.80,15.60,15.10,14.85,14.75,15.25,16.45}$, $\text{16.40,16.55,17.10,16.90,16.80,17.00,16.40,16.50,16.60$, $16.65,16.70,16.85,17.00,17.25,17.50,17.45,17.60,17.75}$, $\text{17.40,17.35,17.45,17.50,17.60,17.50,17.65,17.25,18.10$, $17.00,17.20,17.50,17.80,17.90 .}$
AnswerInitial class: $12 - 13,$ Exclusive continuous frequency distribution
Classes: $12 - 13, 13 -14, .............., 17- 18, 18 -19$
Frequency: $1, 3, 6, 6, 12, 21, 1$
View full question & answer→Question 195 Marks
A sample of $40$ screws is taken from the production of screws of a factory and the data on diameters of screws (in $\mathrm{cm}$ ) are as follows:
$\text{1.52,1.53,1.61,1.50,1.59,1.48,1.63,1.45,1.58,1.49,1.54$, $1.62,1.60,1.47,1.62,1.46,1.64,1.44,1.52,1.45,1.50,1.49}$, $\text{1.45,1.52,1.66,1.57,1.48,1.55,1.48,1.51,1.62,1.50,1.49$, $1.60,1.53,1.58,1.47,1.52,1.45,1.61.}$
From this data prepare an inclusive continuous frequency distribution with class length $0.04$ and taking mid value of the last class as $1.655 .$
AnswerLast class: $1.64-1.67$
Classes: $1.44-1.47,1.48-1.51, \ldots \ldots \ldots ., 1.64-1.67$
Frequency: $8,10,8,4,8,2$
View full question & answer→Question 205 Marks
The weekly income (in $Rs$) of $40$ employees of a firm are as follows. Taking class length $15$ and mid value of one class $497.5$, prepare exclusive continuous frequency distribution.
$539,526,514,500,488,460,477,499,503,508,520,544$, $463,548,532,518,548,542,516,532,461,504,495,480$, $498,506,523,540,549,490,500,489,480,540,485$, $523,505,549,495,469 .$
AnswerClass : $490 - 505$
Classes : $460 - 475, 475 - 490,……, 535 - 550$
Frequency : $4, 6, 9, 6, 6, 9$
View full question & answer→Question 215 Marks
Inquiring about the retail price of a commodity from $50$ shops, the observations are obtained as follows. Prepare a frequency distribution such that one of the classes is $20.5$ - $21.0$.
$16.3,17.2,16.8,17.1,17.0,16.7,16.4,17.2,18.3,18.4,19.1$, $18.4,18.6,18.1,17.6,17.8,18.3,16.5,19.4,19.6,20.1,19.9$, $19.8,20.0,19.4,19.5,19.6,19.7,19.7,19.9,20.0,20.3,20.5$, $20.5,20.6,20.8,20.4,20.4,20.5,20.5,20.6,20.5,20.7,20.3$, $20.1,20.0,20.2,20.5,20.8,20.9 .$
AnswerClasses: $16-16.5,16.517, \ldots ., 20.5-21$, br $>$ Frequency $: 2$,
$3,4,2,5,1,3,8,10,12$
View full question & answer→Question 225 Marks
The earning of a shopkeeper (in complete rupees) for $30$ days are as under. Taking the initialclass $8000-8099$, prepare a frequency distribution.
$8200,8370,8180,8425,9030,8075,8700,8520,8875$, $8699,8280,8100,8368,8545,8785,8199,8435,9000,8650$, $8380,8075,8600,8760,8825,8990,9050,8340,8180$, $8290,8585 .$
AnswerClasses: $8000-8099,8100-8199, \ldots ., 9000-9099$
Frequency: $2,4,3,4,2,3,3,3,2,1,3$
View full question & answer→Question 235 Marks
The observations of a data are obtained as follows. Prepare a frequency distribution using these data such that class length is $5$ and one of the classes is $30-34$.
$33,35,37,35,34,36,45,42,37,35,34,33,45,46,37,20,21$, $46,44,45,29,27,28,26,54,47,22,33,32,32,41,41,23,31$, $41,23,21,39,23,33,42,41,33,38,36,40,36,38,24,27 .$
AnswerClasses : $20-24,25-29,30-34, \ldots, 50-54$
Frequency: $8,5,10,12,8,6,1$
View full question & answer→Question 245 Marks
The data on weekly income of $40$ workers of a factory are as follows. Construct an appropriate continuous frequency distribution having $7$ classes.
$290,180,185,264,188,238,220,210,225,198,236,250$, $200,170,195,270,240,205,195,220,235,265,218,232$, $170,220,215,210,285,248,270,245,260,230,185$, $200,210,180,165,240 .$
AnswerClass length $=20$, Exclusive continuous frequency distribution
Classes: $160-180,180-200, \ldots \ldots \ldots \ldots \ldots .280-300$
Frequency.3, $8,8,9,5,5,2$
View full question & answer→Question 255 Marks
The area of $50$ fields (in hectares) is as follows. Prepare an appropriate frequency distribution.
$1.9,2.1,4.2,6.8,8.7,5.7,6.8,9.7,8.3,3.8,2.3,4.1,1.2,3.2$, $4.9,9.8,1.5,6.5,4.9,2.4,2.8,1.2,1.3,3.2,2.8,5.2,7.5,2.5$, $8.7,6.2,3.5,1.6,7.3,1.9,4.2,1.4,6.4,4.5,2.7,5.7,1.6$, $3.8,1.5,1.6,3.2,1.7,4.6,3.8,5.5,6.5 .$
AnswerClass length $=1$, Inclusive continuous frequency distribution
Classes: $1-1.9,2-2.9, \ldots \ldots \ldots . .9-9.9$
Frequency. $12,7,7,7,4,6,2,3,2$
View full question & answer→Question 265 Marks
The daily expense of $40$ students of a hostel is as follows.
Represent it in a suitable continuous frequency distribution.
$14.25,13.75,10.50,11.76,12.00,11.20,13.00,14.10,12.40$, $16.60,13.25,10.00,14.85,15.15,14.00,15.25,13.90,15.95$, $15.00,12.75,16.25,13.20,11.80,14.10,11.10,13.10,15.45$, $12.60,13.75,15.55,14.20,15.80,12.25 .14 .10,15.50,14.70$, $12.30,13.50,14.75,14.50 .$
AnswerClass length $=1$, Exclusive continuous frequency distribution
Classes: $10-11,11-12, \ldots \ldots \ldots .16-17$
Frequency: $2,4,6,8,10,8,2$
View full question & answer→Question 275 Marks
The following data gives the age (in complete years) of $50$ females who committed suicide. Prepare a suitable continuous frequency distribution by taking $9$ classes.
$16,24,20,22,34,40,15,23,31,21,22,24,36,31,21,17,20$, $25,22,23,26,16,18,21,19,52,30,20,27,46,16,21,31,40$, $36,25,24,19,23,21,20,42,43,38,22,24,19,17,21,19 .$
AnswerClass length $=5$, Exclusive continuous frequency distribution
Classes: $15-20,20-25, \ldots \ldots \ldots .50-55$
Frequency. $11,21,4,5,3,4,1,1$
View full question & answer→Question 285 Marks
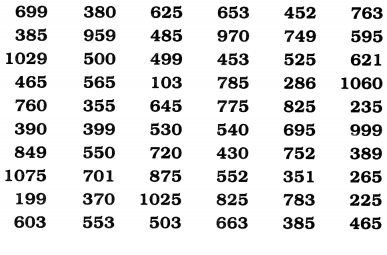
A sample of $50$ bulbs is taken from the lot of electric bulbs produced by a company. The observations on the life of electric bulbs (in hours) are obtained as follows. Construct a suitable continuous frequency distribution taking $10$ classes.
$465,385,663,503,553,683,480,1025,870,435,521,585$, $625,553,975,400,425,495,452,225,625,825,755,645$, $453,495,383,1080,630,785,385,530,720,550,949$, $799,560,376,399,199,270,499,383,351,452,399,429$, $699,285,849 .$
AnswerClass length $= 100$, Inclusive continuous frequency distribution
Classes:$100—199, 200—299, ............. 1000—1099$
Frequency: $1, 3, 8, 12, 8, 7, 4, 3, 2, 2$
View full question & answer→Question 295 Marks
The data related to variations in the price of a share for $30$ days in a share market are as under. Prepare an exclusive continuous of one of classification having class limits the classes as $18.5-20.5$.
$10.50,14.70,17.20,15.20,19.20,15.80,19.30$, $18.40,18.70,14.90,18.50,16.90,12.50,13.60,12.50$, $18.50,14.00,16.20,13.30,3.30,17.6020 .2014 .50$, $20.80,14.50,20.50,10.50,18.60,18.60,14.90$
On the basis of this frequency distribution, answer the following questions:
$(1)$ What is mid value of the 4 th class?
$(2)$ Find the number of days during which the price of share is at the most $Rs. 16.50$.
$(3)$ Find the number of days during which the price of share is at least $Rs. 19.50$.
Answer$(1)$ $17.5$
$(2)$ $16$ days
$(3)$ $6$ days
View full question & answer→Question 305 Marks
Write a short note on two dimensional diagrams.
AnswerWhen the volume of the data is large then considering both length and breadth, a diagram drawn is called two dimensional diagram.
In two dimensional diagrams the total value is shown as an area.
Square, rectangle, circle, pie diagram are two dimensional diagrams.
Circle diagram : When the volume of the data regarding two or more places, things or times is large, then circle diagrams are drawn for such data.
In circle diagram, square roots of the volume of different data are taken as the radius of circle. Arranging the radius in ascending or descending order, circles are drawns with centers on the same line at equal distance from each other. When the data on time are given then circles are drawn in order of time only.
If the square root of the volume is too large, then divide by a constant and if it is too small then multiply by a constant. In this manner determine the radius.
Pie diagram: If the data on different places, things or times consist of several mutually related sub-data are numerically large, pie diagram is drawn.
In this diagram, the total volume of the data is represented by a circle of suitable radius and this circle is divided into sectors in accordance with sub-data.
Here, total volume of the data is taken as $360^\circ $ and the volume of sub-data are expressed in terms of measures of angle and are presented on circle with respective circular sectors.
View full question & answer→Question 315 Marks
Write a short note on one dimensional diagrams.
AnswerA diagram drawn by considering only one characteristic of the data is called one dimensional diagram.
The types of one dimensional diagrams are four:
$1.$ Bar diagram : It is used to represent the data on different places, things or times. To draw bar diagram, the different places, things or times are taken on $X$-axis and the measure of respective places, things or time on $Y$-axis with appropriate scale. Bars with equal width at equal distance are drawn with the height proportional to the measure. The diagram formed in such manner is called bar diagram.
In bar diagram the logical order of bars should be maintained. To make comparative study easy, the bars showing places or things should be arranged in proper order on the graph but the bars showing times are presented as it is on graph paper.
$2.$ Multiple or adjacent bar diagram : When the data about different places, things or times are collected on more than one mutually related characteristics, then multiple bar diagram is drawn by placing the related bars close to each other. if the data given are related to time, then bars are drawn in order of, time but when the data are not related to time then they are arranged in ascending or descending order of any one of the characteristics of the data.
$3.$ Simple divided bar diagram : If the data on different places, things or times consist of several mutually related sub-data on different components are given then simple divided bar diagram is drawn.
In this diagram first of all a bar of proper width and height proportional to the total value of the data is drawn. Then it is divided in accordance with the sub-data into different segments by various signs.
$4.$ Percentage divided bar diagram: In simple divided bar diagram the mutually related sub-data cannot be effectively compared. To overcome this difficu1ty percentage divided bar diagram is drawn.
In this diagram taking the total value of data as 100%, the percentages of sub-data are calculated. A bar of appropriate width and height proportional to 100% is drawn and is divided in accordance with the percentage of sub-data. By such diagram the mutually related sub-data can be effectively compared but the total value cannot be compared.
View full question & answer→Question 325 Marks
Discrete frequency distribution showing the number of children in $50$ families The data regarding the number of children of $50$ families residing in a certain area are given below. Prepare an appropriate frequency distribution.
$1, 1, 2, 1, 1, 1, 1, 2, 1, 0,$
$0, 2, 2, 0, 3, 3, 2, 1, 2, 1,$
$2, 1, 3, 1, 1, 2, 2, 2, 1, 2,$
$3, 0, 3, 0, 2, 1, 2, 3, 3, 2, 1,$
Answer
- Here, the number of children in a family is discrete variable. Therefore we will obtain discrete frequency distribution. In the frequency distribution $x =$ No. of children, $f =$ No. of families. In the given data, the minimum value of $x$ is $O$ and the maximum value is $3.$ Hence the discrete frequency distribution of the number of children is obtained as follows :
| No. of children $x$ |
Tally marks |
No. of families $f$ |
| $0$ |
 |
$6$ |
| $1$ |
 |
$16$ |
| $2$ |
 |
$21$ |
| $3$ |
 |
$7$ |
| Total |
- |
$n = 50$ |
View full question & answer→