Questions

4 Marks Questions

🎯

Test yourself on this topic

16 questions · timed · auto-graded

Question 14 Marks
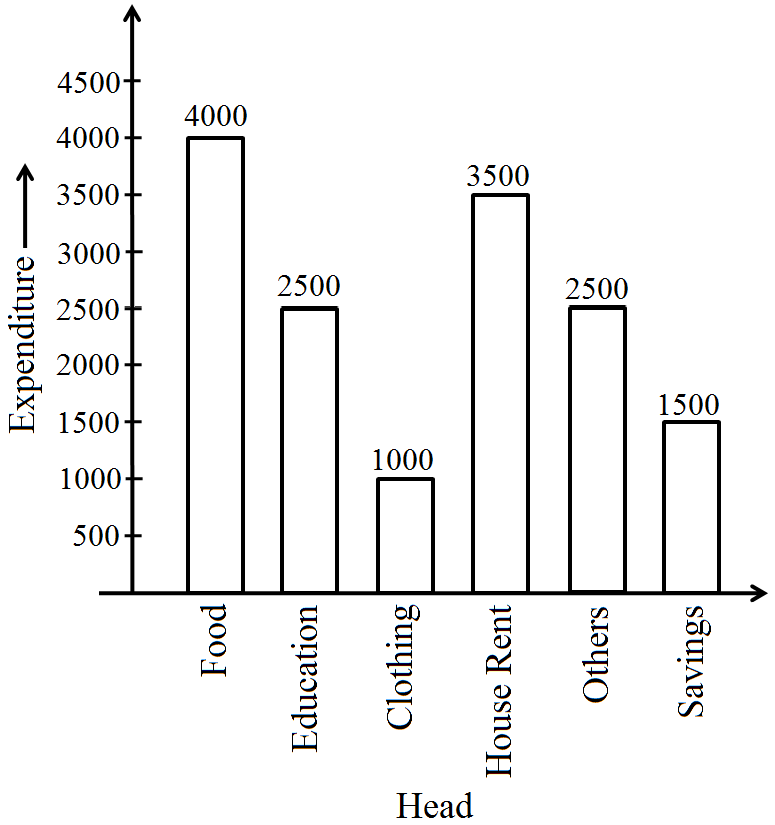
The expenditure of a family on different heads in a month is given below:
Head Food Education Clothing House Rent Others Savings
Expenditure(in Rs.) $4000$ $2500$ $1000$ $3500$ $2500$ $1500$
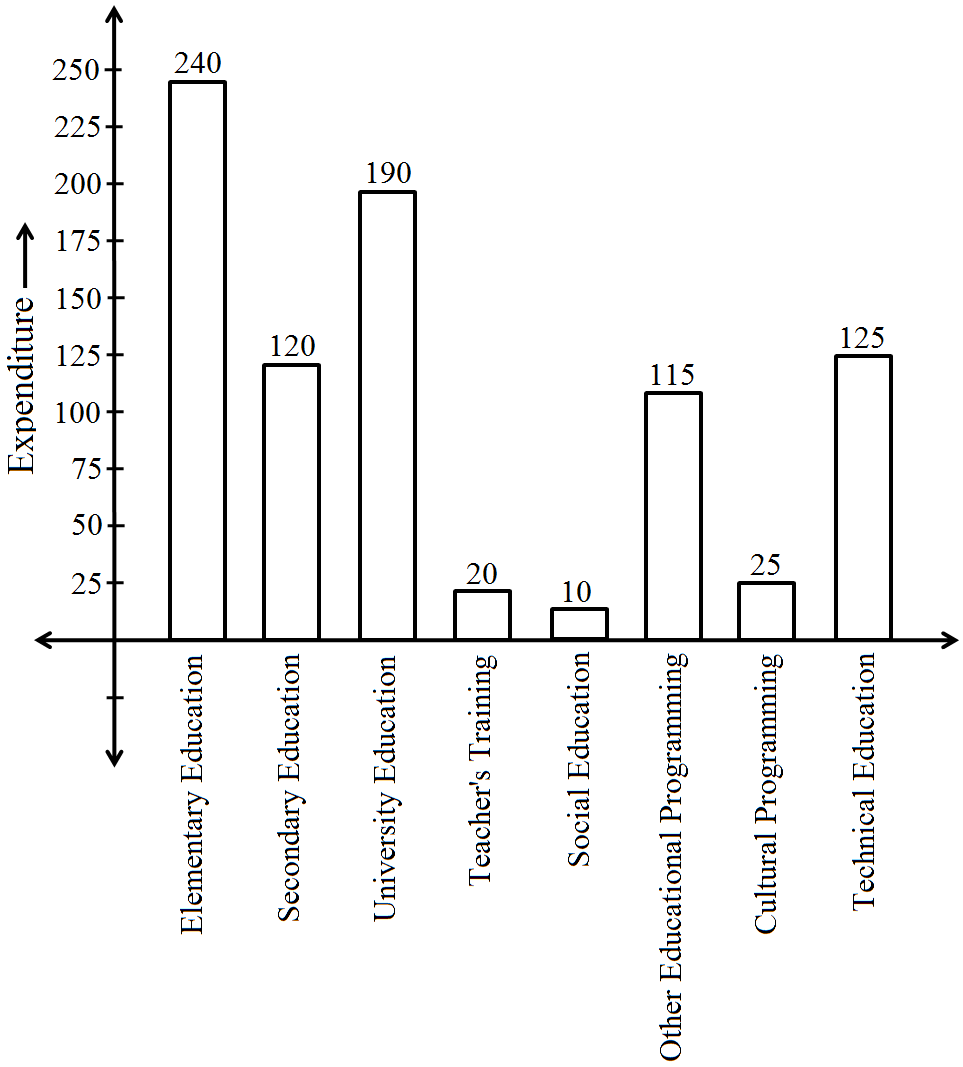
Draw a bar graph to represent the data above.
Answer
We draw a bar graph of this data in the following steps.
Step I: We represent the heads (variable) on the horizontal axis choosing any scale, as the width of the bar is not important. But for clarity, we take equal widths for all bars and maintain equal gaps in between them. Let one head be represented by one unit.
Step II We represent the expenditure on the vertical axis. Since, the maximum expenditure is Rs. $4000$, we can choose the scale as $1$ unit = Rs. $500.$
Step III To represent our first head i.e.,food, we draw a rectangular bar with width $1$ unit and height $8$ units.
Step IV Similarly, other heads are represented by leaving a gap of $\frac{1}{2}\text{unit}$ in between two consecutive bars. The bar graph for given data is shown below:
View full question & answer
Question 24 Marks
Draw a histogram of the following distribution:
Heights (in cm)
Number of students
$150-153$
$153-156$
$156-159$
$159-162$
$162-165$
$165-168$
$7$
$8$
$14$
$10$
$6$
$5$
Answer
Clearly, the given frequency distribution is in exclusive form. Along the horizontal axis, we represent the class intervals of heights on some suitable scale. The corresponding frequencies of number of students are represented along the vertical axis on a suitable scale. Since, the given intervals start with $150-153$. It means that there is some break (vw) is indicated near the origin to signify the graph is drawn with a scale beginning at $150$. A histogram of the given distribution is given below:
View full question & answer
Question 34 Marks
The mean marks (out of $100$) of boys and girls in an examination are $70$ and $73$, respectively. If the mean marks of all the students in that examination is $71$, find the ratio of the number of boys to the number of girls.
Answer
Let the number of boys be $n_1$ and number of girls be $n_2$ Using $\bar{\text{x}}=\frac{\text{n}_1\bar{\text{x}}+\text{n}_2\bar{\text{x}}_2}{\text{n}_1+\text{n}_2}$
Where, $\bar{\text{x}}_1=70,\bar{\text{x}}_2=73$ and $\bar{\text{x}}_3=71$
$71=\frac{\text{n}_1\times70+\text{n}_2\times73}{\text{n}_1+\text{n}_2}$
$\Rightarrow\ 71\text{n}_1+71\text{n}_2=70\text{n}_1+73\text{n}_2$
$\Rightarrow\ \text{n}_1=2\text{n}_2$ $\Rightarrow\ \frac{\text{n}_1}{\text{n}_2}=\frac{2}{1}$
Hence, the ratio of the number of boys to the number of girls in $2 : 1$
View full question & answer
Question 44 Marks
Prepare a continuous grouped frequency distribution from the following data:
Mid-point
Frequency
$5$
$15$
$25$
$35$
$45$
$4$
$8$
$13$
$12$
$6$
Also find the size of class intervals.
Answer
Here, we see that the difference between two mid-points is $15 - 5$
i.e., $10$ It means the width of the class interval is $10$ Let the lower limit of the first class interval be a.
Then, its upper limit $= a + 10$
Now, mid value of the first class interval $= 5$
$\Rightarrow\text{ Mid value}=\frac{\text{Lower limit}+\text{Upper limit}}{2}$
$\Rightarrow5=\frac{\text{a}+\text{a}+10}{2}$
$\Rightarrow2\text{a}+10=10$
$\Rightarrow\text{a}=0$ So, the first class interval is $0-10.$
Now, we prepare a continuous grouped frequency distribution table is given below.
Mid-point
Class interval
Frequency
$5$
$15$
$25$
$35$
$45$
$0-10$
$10-20$
$20-30$
$30-40$
$40-50$
$4$
$8$
$13$
$12$
$6$
Hence, the size of the class interval is $10$ i.e., $10-0$
View full question & answer
Question 54 Marks

Two dice are thrown simultaneously $500$ times. Each time the sum of two numbers appearing on their tops is noted and recorded as given in the following table:
Sum Frequency
$2$
$3$
$4$
$5$
$6$
$7$
$8$
$9$
$10$
$11$
$12$
$14$
$30$
$42$
$55$
$72$
$75$
$70$
$53$
$46$
$28$
$15$
If the dice are thrown once more, what is the probability of getting a sum:
$1. 3?$
$2.$ More than $10?$
$3.$ Less than or equal to $5?$
$4.$ Between $8$ and $12?$
Answer
Total number of times, when two dice are thrown simultanceously, $n(s)=500$
Number of times of getting a sum $3, n(E)=30$
$\therefore$ Probability of getting a sum $3=\frac{ n ( E )}{ n ( S )}=\frac{30}{500}=\frac{30}{500}=\frac{3}{50}=0.06$
Hence, the probability of getting a sum $3$ is $0.06$
Number of times of getting a sum more than $10, n\left(E_{-} 1\right)=28+15=43$
$\therefore$ Probability of getting a sum $10=\frac{ n \left( E _1\right)}{ n ( S )}=\frac{43}{500}=0.086$
Hence, the probability of getting a sum more than $10$ is $0.086$
Number of times of getting a sum less than or equal to $5$
$n\left(E_{-} 2\right)=55+42+30+14=141$
$\therefore$ Probability of getting a sum less than or equal to $5=\frac{ n \left( E _2\right)}{ n ( S )}=\frac{141}{500}=0.282$
Hence, the probability of getting a sum less than or equal to $5$ is $0.282$
The number of times of geeting a sum between $8$ and $12$
$n\left(E_{-} 3\right)=53+46+28=127$
$\therefore$  Required probability $=\frac{n\left(E_3\right)}{n(S)}$
$=\frac{127}{500}=0.254$
Hence, the probability of getting a sum between $8$ and $2$ is $0.254$
View full question & answer
Question 64 Marks
The mean of the following distribution is $50$.
X
f
$10$
$30$
$50$
$70$
$90$
$17$
$5a + 3$
$32$
$7a - 11$
$19$
Find the value of a and hence the frequencies of $30$ and $70$.
Answer
$x_i$
$f_i$
$f_ix_i$
$10$
$30$
$50$
$70$
$90$
$17$
$5a + 3$
$32$
$7a - 11$
$19$
$170$
$150a + 90$
$1600$
$490a - 770$
$1710$
Total
$\sum\text{f}_\text{i}=60+12\text{a}$
$\sum\text{f}_\text{i}\text{x}_\text{i}=2800+640\text{a}$
$\bar{\text{x}}=\frac{\sum\text{f}_\text{i}\text{x}_\text{i}}{\sum\text{f}_\text{i}}$
$=\frac{2800+640\text{a}}{60+12\text{a}}$
$\therefore\ \frac{2800+640\text{a}}{60+12\text{a}}=50$
$\Rightarrow\ 2800+640\text{a}=3000+600\text{a}$
$\Rightarrow\ 40\text{a}=200$
$\Rightarrow\ \text{a}=\frac{200}{40}$
$\Rightarrow\ \text{a}=5$
So, frequency of $30 = 5a + 3 = 5(5) + 3 = 25 + 3 = 28$
and frequancy of $70 = 7a - 11 = 7(5) - 11 = 35 - 11 = 24$
View full question & answer
Question 74 Marks
A recent survey found that the ages of workers in a factory is distributed as follows:
Age $($in years$)$ $20-39$ $30-39$ $40-49$ $50-59$ $60$ and above
Number of workers $38$ $27$ $86$ $46$ $3$
If a person is selected at random, find the probability that the person is:
$i. 40$ years or more.
$ii.$ Under $40$ years.
$iii.$ Having age from $30$ to $39$ years.
$iv.$ Under $60$ but over $39$ years.
Answer
Total number of workers in a factory.
$n(S) = 38 + 27 86 + 46 + 3 = 200$
$i.$ Number of persons selected at the age of $40$ year or more,
$n(E_1) = 86 + 46 + 3 = 135$
Probability that the persons selected at the age of $40$ year or more,
$\text{P}(\text{E}_1)=\frac{\text{n}(\text{E}_1)}{\text{n(S)}}=\frac{135}{200}=0.675$
Hence, the probability that the person selected at the age of $40$ year or more is $0.675$
$ii.$ Number of persons selected under the age of $40$ year
$n(E_2) = 38 + 27 = 65$
Probability that the persons selected under the age of $40$ year
$\text{P}(\text{E}_2)=\frac{\text{n}(\text{E}_2)}{\text{n(S)}}=\frac{65}{200}=0.325$
Hence, the probability that the person selected at the age of $40$ year or more is $0.325$
$iii.$ Number of persons selected having age from $30$ to $39$ year
$n(E_3) = 27$
Probability that the person selected having age from $30$ to $39$ year
$\text{P}(\text{E}_3)=\frac{\text{n}(\text{E}_3)}{\text{n(S)}}=\frac{27}{200}=0.135$
Hence, the probability that the person selected having age from $30$ to $39$ year is $0.135$
$iv.$ Number of persons selected having age under $60$ but over $39$ year
$n(E_4) = 86 + 46 = 132$
Probability that the person selected having age under $60$ but over $39$ year
$\text{P}(\text{E}_4)=\frac{\text{n}(\text{E}_4)}{\text{n(S)}}=\frac{132}{200}=0.66$
Hence, the probability that the person selected having age under $60$ but over $39$ year is $0.66$
View full question & answer
Question 84 Marks
The lengths of $62$ leaves of a plant are measured in millimetres and the data is represented in the following table:
Length (in mm)
Number of leaves
$118-126$
$127-135$
$136-144$
$145-153$
$154-162$
$163-171$
$172-180$
$8$
$10$
$12$
$17$
$7$
$5$
$3$
raw a histogram to represent the data above.
Answer
The given frequency distribution is in inclusive form. So, first we convert it into exclusive form.
Now, adjusting factor $=\frac{(127-126)}{2}=\frac{1}{2}=0.5$
So, we subtract $0.5$ from each lower limit and add $0.5$ to each upper limit.
The table for continuous grouped frequency distribution is given below:
Length (in mm)
Number of leaves
$117.5-126.5$
$126.5-135.5$
$135.5-144.5$
$144.5-153.5$
$153.5-162.5$
$162.5-171.5$
$171.5-180.5$
$8$
$10$
$12$
$17$
$7$
$5$
$3$
The table for continuous grouped frequency destribution is given below. Thus, the given data becomes in exclusive form.
Along the horizontal axis, we represent the class intervals of length on some suitable scale. The corresponding frequencies of number of leaves are represented along the $Y-$axis on a suitable scale. Since, the given intervals start with $117.5-126.5$ It means that, there is some break (vw) indicated near the origin to signify the graph is drawn with a scale beginning at $117.5$
View full question & answer
Question 94 Marks
The marks obtained (out of $100$) by a class of $80$ students are given below:
Marks
Number of Student
$10-20$
$20-30$
$30-50$
$50-70$
$70-100$
$6$
$17$
$15$
$16$
$26$
Construct a histogram to represent the data above.
Answer
In the given frequency distribution, class sizes are different. So, we calculate the adjusted frequency for each class. Here, minimum size = 20 - 10 = 10 We use the formula, Adjusted frequency of a class $=\frac{\text{Minimum class size}}{\text{Class size of this class}}\times\text{its frequency}$ The modified table for frequency distribution is given by,
Marks Number of Student(Frequency) Adjusted frequency
$10-20$
$20-30$
$30-50$
$50-70$
$70-100$
$6$
$17$
$15$
$16$
$26$
$\frac{10}{10}\times6=6$
$\frac{10}{10}\times17=17$
$\frac{10}{20}\times15=\frac{15}{2}=7.5$
$\frac{10}{20}\times16=\frac{16}{20}=8$
$\frac{10}{30}\times26=\frac{26}{3}=8.67$
Along the horizontal axis, we represent the class intervals marks on some suitable scale. The corresponding frequencies of number of students are represented along the vertical axis on a suitable scale. Since, the given intervals start with $10-20$. It means that, there is some break ($AW$) indicated near the origin to signify the graph is drawn with a scale beginning at $10.$
Now, we draw rectangles with class intervals as the bases and the corresponding adjusted frequencies as heights. A histogram of the given distribution, is given below:
View full question & answer
Question 104 Marks
Convert the given frequency distribution into a continuous grouped frequency distribution:
Class interval
Frequency
$150-153$
$154-157$
$158-161$
$162-165$
$166-169$
$170-173$
$7$
$7$
$15$
$40$
$5$
$6$
In which intervals would $153.5$ and $157.5$ be included?
Answer
It is clear that, the given table is in inclusive (discontinuous) form.
So, we first convert it into exclusive form.
Now, consider the classes $150 - 153, 154 - 157$
Lower limit of $154 - 157 = 154$ and upper limit of $150-153 = 153$
Required difference $= 154 - 153 = 1$
So, half the difference $=\frac{1}{2}=0.5$
So, we subtract $0.5$ from each lower limit and add $0.5$ to each upper limit.
The table for continuous grouped frequency distribution is given below:
Class interval
Frequency
$149.5-153.5$
$153.5-157.5$
$157.5-161.5$
$161.5-165.5$
$165.5-169.5$
$169.5-173.5$
$7$
$7$
$15$
$10$
$5$
$6$
Thus, $153.5$ and $157.5$ would use in the class intervals $153.5-157.5$ and $157.5-161.5$, respectively.
View full question & answer
Question 114 Marks
Expenditure on Education of a country during a five year period ($2002-2006$), in crores of rupees, is given below:
Elementary education
Secondary Education
University Education
Teacher’s Training
Social Education
Other Educational Programmes
Cultural programmes
Technical Education
$240$
$120$
$190$
$20$
$10$
$115$
$25$
$125$
Represent the information above by a bar graph.
Answer
We draw bar graph of this data in the following steps:
Step I We represent the education of a country (variable) on the horizontal axis choosing any scale, as the width of the bar is not important. But for clarity, we take equal widths for all bars and maintain equal gaps in between them. Let one head be represented by one unit.
Step II We represent the expenditure on the vertical axis. Since, the maximum expenditure is Rs. $240$ crore, we can choose the scale as $1$ unit = Rs. $25$ crore.
Step III To represent our first education of a country i.e.,elementary education, we draw a rectangular bar with width $1$ unit and height 9.6 units.
Step IV Similarly, other heads are represented by leaving gap of ~ unit in between two consecutive bars. The bar graph for given data is shown below:
View full question & answer
Question 124 Marks
Draw the frequency polygon representing the above data without drawing the histogram.
Answer
We have to draw a frequency polygon without a histogram. Firstly,
 we find the class marks of the classes given that is $30-40, 40-50, 50-60, 60-70 .... $
The class mark $=\frac{(30+40)}{2}$
$\Rightarrow\frac{70}{2}=35$ Similarly, we can determine the class marks of the other classes.
So, table for class marks is shown below:
Class interval (km/ h)
Class marks
Frequency
$30-40$
$40-50$
$50-60$
$60-70$
$70-80$
$80-90$
$90-100$
$35$
$45$
$55$
$65$
$75$
$85$
$95$
$3$
$6$
$25$
$65$
$50$
$28$
$14$
We can draw a frequency polygon by plotting the class marks along the horizontal axis and the frequency along the vertical axis.
Now, plotting all the points $B(35, 3), C(45, 6), D(55, 25), E(65, 65), F(75, 50), G(85, 28), H(95,14)$, also plot the point corresponding to the considering classes $20-30$ and $100-110$ each with frequency 0. Join all these point line segments.
View full question & answer
Question 134 Marks
Draw a histogram to represent the following grouped frequency distribution:
Ages (in years)
Number of teachers
$20-24$
$25-29$
$30-34$
$35-39$
$40-44$
$45-49$
$50-54$
$10$
$28$
$32$
$48$
$50$
$35$
$12$
Answer
The given frequency distribution is in inclusive form. So, first we convert it into exclusive form. Now, consider the class 20-24, 25-29. Lower limit of 25-29 is 25. Upper limit of 20-24 is 24. Thus, the half of the difference is $=\frac{(25-24)}{2}=\frac{1}{2}=0.5$ So, we subtract 0.5 from each lower limit and add 0.5 to each upper limit. The table for continuous grouped frequency distribution is given below:
Ages (in years)
Number of teachers
$19.5-24.5$
$24.5-29.5$
$29.5-34.5$
$34.5-39.5$
$39.5-44.5$
$44.5-49.5$
$49.5-54.5$
$10$
$28$
$32$
$48$
$50$
$35$
$12$
Thus, the given data becomes in exclusive form. Along the horizontal axis, we represent the class intervals of ages on some suitable scale. The corresponding frequencies of number of teachers are represented along the vertical axis on a suitable scale. Since, the given intervals start with $19.5-24.5$. It means that, there is some break (vw) indicated near the origin to signify the graph is drawn with a scale beginning at $19.5$. A histogram of the given distribution is given below:
View full question & answer
Question 144 Marks
A total of $25 $patients admitted to a hospital are tested for levels of blood sugar, (mg/ dl) and the results obtained were as follows:
$87$
$71$
$83$
$67$
$85$
$77$
$69$
$76$
$65$
$85$
$85$
$54$
$70$
$68$
$80$
$73$
$78$
$68$
$85$
$73$
$81$
$78$
$81$
$77$
$75$
Find mean, median and mode (mg/ dl) of the above data.
Answer
Mean, Sum of akll observations $= 1891$
Number of observations, $n = 25$
$\text{Mean}(\bar{\text{x}})=\frac{\text{x}_1+\text{x}_2+\ .....\ +\text{x}_\text{n}}{\text{n}}$
$=\frac{1891}{25}=75.64$
 Median, Arranging the observation in ascending orther,
we get $54, 65, 67, 68, 68, 69, 70, 71, 73, 73, 75, 76, 77,. 77, 78, 78, 80, 81, 81, 83, 85, 85, 85, 87$
Here, number of observation (n) = 25(odd)
$\therefore\ \text{Median}=\Big(\frac{\text{n}+1}{2}\Big)^{\text{th}}\text{value}$
$=\Big(\frac{25+1}{2}\Big)^{\text{th}}\text{value}$ $=13^{\text{th}}\text{value}=77$
We see from the given data that the onservation 85 occurs maximum number of times (4 times).
$\therefore\ \text{Mode}=85$
Hence, mean $=75.64$, median $=77$ and mode $=85$
View full question & answer
Question 154 Marks
Following table shows a frequency distribution for the speed of cars passing through at a particular spot on a high way:
Class interval (km/ h)
Frequency
$30-40$
$40-50$
$50-60$
$60-70$
$70-80$
$80-90$
$90-100$
$3$
$6$
$25$
$65$
$50$
$28$
$14$
Draw a histogram and frequency polygon representing the data above.
Answer
Clearly, the given frequency distribution is in exclusive form. Along the horizontal axis, we represent the class intervals on some suitable scale. The corresponding frequencies are represented along the vertical axis on a suitable scale. We construct rectangles with class intervals as the bases and the respective frequencies as the heights. Let us draw a histogram for this data and mark the mid-points of the top of the rectangles as $B, C, D, E, F, G$ and $H$, respectively. Here, the first class is $30-40$ and the last class is $90-100$. Also, consider the imagined classes 20-30 and 100-110 each with frequency $O$. The class marks of these classes are $25$ and 105 at the points A and I, respectively


Join all these points by dotted line. Then, the curve $ABCDEFGHI$ is the required frequency polygon.
View full question & answer
Question 164 Marks
Over the past $200$ working days, the number of defective parts produced by a machine is given in the following table:
Number of defective parts $0$ $1$ $2$ $3$ $4$ $5$ $6$ $7$ $8$ $9$ $10$ $11$ $12$ $13$
Days $50$ $32$ $22$ $18$ $12$ $12$ $10$ $10$ $10$ $8$ $6$ $6$ $2$ $2$
Determine the probability that tomorrow’s output will have:
$i.$ No defective part.
$ii.$ Atleast one defective part.
$iii.$ Not more than $5$ defective parts.
$iv.$ More than $13$ defective parts.
Answer
Total number of working days, $n(S) = 200$
$i.$ Number of days in which no defective part is, $n(E_1) = 50$
Probability that no defective part $=\frac{\text{n}(\text{E}_1)}{\text{n(S)}}=\frac{50}{200}=\frac{1}{4}=0.25$
$ii.$ Number of days in which atleast one defective part, is
$n(E_2) = 32 + 22 + 18 + 12 + 12 + 10 + 10 + 10 + 8 + 6 + 6 + 2 + 2 = 150$
$\therefore$ Probability that atleast one defective part $=\frac{\text{n}(\text{E}_2)}{\text{n}(\text{s})}=\frac{150}{200}=\frac{3}{4}=0.75$
Hence, the probability that all least one defective part is $0.75.$
$iii.$ Number of days in which not more than $5$ defective parts.
$n(E_3)= 50 + 32 + 22 + 18+ 12 + 12 = 146$
$\therefore$ Probability that not more than $5$ defective parts
$=\frac{\text{n}(\text{E}_3)}{\text{n}(\text{S})}=\frac{146}{200}=0.73$
Hence, the probability that not more than $5$ defective parts is $0.73.$
$iv.$ Number of days in which more than $13$ defective parts, $n(E_4) = 0$
$\therefore$ Probability that more than $13$ defective parts
$=\frac{\text{n}(\text{E}_4)}{\text{n}(\text{S})}=\frac{0}{200}=0$
Hence, the probability that more than $13$ defective parts is $0.$
View full question & answer
4 Marks Questions - Maths STD 9 Questions - Vidyadip