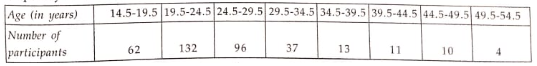
Questions

Case study (4 Marks)

Take a timed test

10 questions · self-marked practice — reveal the answer and mark yourself.

Question 14 Marks
Answer
(i) -(d), (ii) - (b), (iii) - (c), (iv) - (d)
View full question & answer
Question 24 Marks
Answer
(i) - (d), (ii) - (b), (iii) - (a), (iv) - (c)
View full question & answer
Question 34 Marks
Answer
(i) - (b), (ii) - (b), (iii) - (a), (iv) - (a)
View full question & answer
Question 44 Marks
Answer
(i) - (c), (ii) - (c), (iii) - (b), (iv) - (c)
View full question & answer
Question 54 Marks
Answer
(i) The cumulative frequency distribution is as given below:
Numbers announced0-1515-3030-4545-6060-75
Number of times (f)8910129
Cumulative frequency817273948 = N

We find that $N=\Sigma f_i=48$ and $\frac{N}{2}=24$. The cumulative frequency just greater than $\frac{N}{2}$ i.e. 24 is 27 and the corresponding class is 30-45. So, 30-45 is the median class.
(ii) There are 75 balls out of which 37 balls are even numbered.
∴ Probability of calling out an even number = $\frac{37}{75}$
(iii) (a) We find that 30-45 is the median class with l = 30, f = 10, h = 15, F = 17 and N = 48.
$\therefore \quad$ Median $=l+\frac{\frac{N}{2}-F}{f} \times h=30+\frac{24-17}{10} \times 15=30+\frac{7 \times 3}{2}=40.5$
(b) We observe that 45-60 is the modal class with l = 45, f = 12, $f_1=10, f_2=9$ and $h=15$.
$\therefore \quad$ Mode $=l+\frac{f-f_1}{2 f-f_1-f_2} \times h=45+\frac{12-10}{24-10-9} \times 15=45+\frac{2}{5} \times 15=51$

View full question & answer
Question 64 Marks
Activities like running or cycling reduce stress and the risk of ental disorder like depression. Running helps build endurance. Children develop stronger bones and uscles and are less prone to gain weight. The physical education teacher of a school has decided to conduct an inter school running tournaent in his school preises. The tie taken by a group of students to run 100 , was noted as follows:
Iage
Tie (in seconds)0-2020-4040-6060-8080-100
Nuber of students8101363

Based on the above, answer the following questions:
(i) What is the edian class of the above given data?
(ii) (a) Find the ean tie taken by the students to finish the race.
OR
(b) Find the ode of the above given data.
(iii) How any students took tie less than 60 seconds?
Answer
(i) The cumulative frequency distribution is

Time (in seconds)0-2020-4020-4060-8080-100
Number of students8101363
Cumulative frequency818313740

We find that $N=\Sigma f_i=40$ and $\frac{N}{2}=20$ The cumulative frequency just greater $\frac{N}{2}$ i.e. 20 is 31 and the corresponding class is 40-60. So, median class is 40-60.
(ii) (a)

Computation of mean time

Time (in seconds) (Class)Number of students $\left(f_i\right)$Mid-values$x_i$$u_i=\frac{x_i-50}{20}$$f_i \mu_i$
0-20810-2-16
20-401030-1-10
40-60135000
60-8067016
80-10039026
 $\Sigma f_i=40$  $\Sigma f_1 u_i=-14$

We obtain, 
$N=\Sigma f_i=40, a=50, h=20$ and $\Sigma f_i u_i=-14$
Mean time $=a+h\left(\frac{1}{N} \Sigma f_i u_i\right)=50+20 \times-\frac{14}{40}=43$
Hence, mean time taken by the students to finish the seconds. 
OR
(b) We find that 40-60 is the modal class with $l=40, f=13, f_1=10, f_2=6$ and $h=20$.
$\therefore \quad$ Mode $=L+\frac{f-f_1}{2 f-f_1-f_2} \times h=40+\frac{13-10}{26-10-6} \times 20=46$
(iii) From the cumulative frequency table in (i), we find that the number of students who took less than 60 seconds to finish the race is 31.

View full question & answer
Question 74 Marks
Vocational training copleents traditional education by providing practical skills and hands-on experience. While education equips individuals with a broad knowledge base, vocational training focuses on job-specific skills, enhancing eployability thus aking the student self-reliant. Keeping this in view, a teacher ade the following table grving the frequency distribution of students/adults undergoing vocational training fro the training institute.
Iage
Age (in years)15-1920-2425-2930-3435-3940-4445-4950-54
Nuber of participants6213296371311104

Fro the above, answer the following questions:
(i) What is the lower liit of the odal class of the above data?
(ii) (a) Find the edian class of the above data.
OR
(b) Find the nuber of participants of age less than 50 years who undergo vocational training.
(iii) Give the epirical relationship between ean, edian and ode.
View full question & answer
Question 84 Marks
Answer

(i) 600-800 mm rainfall is in maximum number of sub-divisions. Therefore, 600-800 is the modal class.
(ii) The cumulative frequency distribution is as given below:

Rainfall (mm)Number of sub-divisions (f)Cumulative frequency
200-40022
400-60046
600-800713
800-1000417
1000-1200219
1200-1400322
1400-1600123
1600-1800124
  N = 24

We have, $N=\Sigma f_i=24 \Rightarrow \frac{N}{2}=12$
The cumulative frequency just greater than $\frac{N}{2}$ i.e. 12 is 13 and the corresponding class is 600-800. It is the median class with l = 600 f = 7 h = 200 and F = 6.
$\therefore \quad$ Median $=l+\frac{\frac{N}{2}-F}{f} \times h \Rightarrow$ Median $=600+\frac{12-6}{7} \times 200=600+171.4=771.4 mm$
(iii)

Computation of Mean 

Rainfall
(mm)
Mid values $\left(x_i\right)$$\frac{x_i-1100}{200}=u_i$Number of Sub-divisions $\left(f_i\right)$$f_i u_i$
200-400300-42-8
400-600500-34-12
600-800700-27-14
800-1000900-14-4
1000-12001100020
1200-14001300133
1400-16001500212
1600-18001700313
    $\Sigma f_i u_i=-30$

We find that a = 1100 200, N = 24 
Mean $=a+h \times\left(\frac{1}{N} \Sigma f_i u_i\right) \Rightarrow$ Mean $=1100+200 \times \frac{-30}{24}=1100-250=850 mm$
(IV) Number of sub-divisions having at least 1000 m rainfall = 2 + 3 + 1 + 1 = 7.
Hence, 7 sub-divisions have good rainfall


View full question & answer
Question 94 Marks
Answer

(i) : (c)

Computation of median

Weekly consumptionNumber of families (f)Cumulative frequency (c.f.)
0-101616
10-201228
20-301846
30-40652
40-50456
50-60056
  $\quad$$\quad$N = 56

We have, N = 56 The cumulative frequency just greater than N/2 = 28 is 46 and the corresponding class is 10-20. It is the median class with $l=10, N=56, f=12, f=16$ and $h=10$.
Median $=l+\frac{2^N-r}{f} \times h \Rightarrow$ Median $=10+\frac{28-16}{12} \times 10=20$

Weekly consumptionNumber of families$\left(f_i\right)$Mid-values $\left(x_i\right)$$\quad$$u_i=\frac{x_i-35}{10}$$\quad$$f_i u_i$
0-10165-3-48
10-201215-2-24
20-301825-1-18
30-4063500
40-5044514
50-6005520
 $N=\Sigma f_i=56$  $N=\Sigma f_i u_i=-86$

$\therefore \quad \bar{X}=a+\left(\frac{1}{N} \Sigma f_i u_i\right) h=35+\frac{1}{56} \times-86 \times 10=19.64$
(iii) (c). The class with maximum frequency is 20-30. So, the modal class is 20-30. 
(iv) (b): The modal class is 40 40-50 with $l=40, f=40, f_1=20, f_2=5$ and $h=10$.
$\therefore \quad$ Mode $=1+\frac{f-f_1}{2 f-f_1-f_2}=40+\frac{40-20}{80-20-5} \times 10=40+\frac{200}{55}=43.6$
View full question & answer
Question 104 Marks
Answer
(i) (c): We have to find the mode of the frequency distribution. The modal class is$35-45$ with $l=35, f=23, f_1=21, f_2=14$ and $h=10$.
$\therefore$ Mode $=35+\frac{23-21}{46-21-14} \times 10=35+\frac{20}{11}=36.82 \quad\left[\because\right.$ Mode $\left.=l+\frac{f-f_1}{2 f-f_1-f_2} \times h\right]$
(ii) (c): Clearly, 35-45 is the modal class and its upper limits is 45.
(iii) (d):

Computation of average age

Age
(in years)
Number of cases$\left(f_i\right)$Mid-values$\left(x_i\right)$$u_i=\frac{x_i-30}{10}$$f_1 u_i$
5-15610-2-12
15-251120-1-11
25-35213000
35-452340123
45-551450228
55-65560315
 $\quad$$\quad$N = 80  $\Sigma f_i u_i=43$

$\therefore \quad \bar{X}=a+h\left(\frac{1}{N} \Sigma f_1 u_i\right) \Rightarrow \bar{X}=30+10\left(\frac{43}{80}\right)=35.37 \simeq 35.4$
(iv) (a): We observe that 35 - 45 is the modal class with $l=35, f=42, f_1=10, f_2=24$ and $h=10$.
$\therefore \quad$ Mode $=35+\frac{42-10}{84-10-24} \times 10=35+\frac{320}{50}=41.4$
View full question & answer