Questions

5 Marks Questions

Take a timed test

16 questions · self-marked practice — reveal the answer and mark yourself.

Question 15 Marks
Take the data giving the minimum and the maximum temperature of various cities given in Table. Plot a double bar graph using the data and answer the question: Name the city which has the least difference between its minimum and the maximum temperature.
Temperatures of Cities as on $20.6.2006$
City Max. Min.
Ahmedabad $38^{\circ} \mathrm{C}$ $29^{\circ} \mathrm{C}$
Amritsar $37^{\circ} \mathrm{C}$ $26^{\circ} \mathrm{C}$
Banglore $28^{\circ} \mathrm{C}$ $21^{\circ} \mathrm{C}$
Chennai $36^{\circ} \mathrm{C}$ $27^{\circ} \mathrm{C}$
Delhi $38^{\circ} \mathrm{C}$ $28^{\circ} \mathrm{C}$
Jaipur $39^{\circ} \mathrm{C}$ $28^{\circ} \mathrm{C}$
Jammu $41^{\circ} \mathrm{C}$ $26^{\circ} \mathrm{C}$
Mumbai $32^{\circ} \mathrm{C}$ $27^{\circ} \mathrm{C}$
Answer


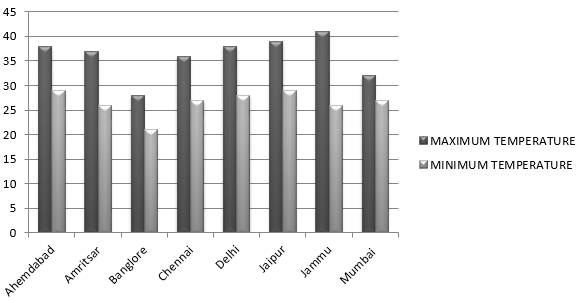
From the graph, The least difference between the maximum and minimum bars corresponding to Mumbai.
Hence, it can be concluded that,
Mumbai is city with the least difference in its maximum temperature and minimum temperatures on $20.06.2006$
View full question & answer
Question 25 Marks
Take the data giving the minimum and the maximum temperature of various cities given in Table. Plot a double bar graph using the data and answer the question: Name two cities where maximum temperature of one was less than the minimum temperature of the other.
Temperatures of Cities as on $20.6.2006$
City Max. Min.
Ahmedabad $38^{\circ} \mathrm{C}$ $29^{\circ} \mathrm{C}$
Amritsar $37^{\circ} \mathrm{C}$ $26^{\circ} \mathrm{C}$
Banglore $28^{\circ} \mathrm{C}$ $21^{\circ} \mathrm{C}$
Chennai $36^{\circ} \mathrm{C}$ $27^{\circ} \mathrm{C}$
Delhi $38^{\circ} \mathrm{C}$ $28^{\circ} \mathrm{C}$
Jaipur $39^{\circ} \mathrm{C}$ $28^{\circ} \mathrm{C}$
Jammu $41^{\circ} \mathrm{C}$ $26^{\circ} \mathrm{C}$
Mumbai $32^{\circ} \mathrm{C}$ $27^{\circ} \mathrm{C}$
Answer


Here, we have to find the two cities where maximum temperature of one was less than the minimum temperature of the other.
From the graph, Bangalore has its maximum temperature as $28^\circ C.$
Whereas, The minimum temperature of the two cities Jaipur and Ahmedabad is $29^\circ C$
Hence, It can be concluded that the required pair of two cities are, Bangalore and Jaipur and Bangalore and Ahmedabad.
View full question & answer
Question 35 Marks
Take the data giving the minimum and the maximum temperature of various cities given in Table. Plot a double bar graph using the data and answer the question: Which is the hottest city and which is the coldest city?
Temperatures of Cities as on $20.6.2006$
City Max. Min.
Ahmedabad $38^{\circ} \mathrm{C}$ $29^{\circ} \mathrm{C}$
Amritsar $37^{\circ} \mathrm{C}$ $26^{\circ} \mathrm{C}$
Banglore $28^{\circ} \mathrm{C}$ $21^{\circ} \mathrm{C}$
Chennai $36^{\circ} \mathrm{C}$ $27^{\circ} \mathrm{C}$
Delhi $38^{\circ} \mathrm{C}$ $28^{\circ} \mathrm{C}$
Jaipur $39^{\circ} \mathrm{C}$ $28^{\circ} \mathrm{C}$
Jammu $41^{\circ} \mathrm{C}$ $26^{\circ} \mathrm{C}$
Mumbai $32^{\circ} \mathrm{C}$ $27^{\circ} \mathrm{C}$
Answer


The Double bar graph for the given data is shown above.
We have to find the hottest and coolest city from the given cities while looking into the graph.
and, We know that, the hottest city would have the maximum temperature
And, coolest city would have the least temperature.
From the graph,
The highest bar for maximum temperature corresponds to Jammu.
Hence, Jammu is the hottest city.
And, the lowest bar of minimum temperature corresponds to Bangalore,
Hence, Bangalore is the coolest city among the given cities.
View full question & answer
Question 45 Marks
Take the data giving the minimum and the maximum temperature of various cities given in Table. Plot a double bar graph using the data and answer the question: Which city has the largest difference in the minimum and maximum temperature on the given date?
Temperatures of Cities as on $20.6.2006$
City Max. Min.
Ahmedabad $38^{\circ} \mathrm{C}$ $29^{\circ} \mathrm{C}$
Amritsar $37^{\circ} \mathrm{C}$ $26^{\circ} \mathrm{C}$
Banglore $28^{\circ} \mathrm{C}$ $21^{\circ} \mathrm{C}$
Chennai $36^{\circ} \mathrm{C}$ $27^{\circ} \mathrm{C}$
Delhi $38^{\circ} \mathrm{C}$ $28^{\circ} \mathrm{C}$
Jaipur $39^{\circ} \mathrm{C}$ $28^{\circ} \mathrm{C}$
Jammu $41^{\circ} \mathrm{C}$ $26^{\circ} \mathrm{C}$
Mumbai $32^{\circ} \mathrm{C}$ $27^{\circ} \mathrm{C}$
Answer


Here,
We have to find the city with the largest difference in its maximum and minimum temperature.
From the graph, we see that
The largest difference between the maximum and minimum bars is of Jammu.
Hence,
It can be concluded that,
Jammu is city with the largest difference in its maximum temperature and minimum temperatures on $20.06.2006$
View full question & answer
Question 55 Marks
Consider this data collected from a survey of a colony.
Favourite Sport Cricket Basket Ball Swimming Hockey Athletics
Watching $1240$ $470$ $510$ $423$ $250$
Participating $620$ $320$ $320$ $250$ $105$
Which is more preferred, watching or participating in sports?
Answer


After, plotting a double bar graph, it can be easily seen that the most watching and participating sports is cricket.
View full question & answer
Question 65 Marks
Consider this data collected from a survey of a colony.
Favourite Sport Cricket Basket Ball Swimming Hockey Athletics
Watching $1240$ $470$ $510$ $423$ $250$
Participating $620$ $320$ $320$ $250$ $105$
Which sport is the most popular?
Answer


From the above bar graph,
We can observe that:
The tallest bar corresponds to the people who like either watching or participating in cricket.
Hence, it can be concluded that,
Cricket is the most popular game whom people either like to watch or participate.
View full question & answer
Question 75 Marks
Consider this data collected from a survey of a colony.
Favourite Sport Cricket Basket Ball Swimming Hockey Athletics
Watching $1240$ $470$ $510$ $423$ $250$
Participating $620$ $320$ $320$ $250$ $105$
Draw a double bar graph choosing an appropriate scale. What do you infer in the bar graph?
Answer
We can draw the double graph of the given data as shown below:

The double bar graph represents the number of people who like watching and participating in various sports.
Now, we can observe that,
The maximum number of people are fond of either watching or participating in cricket.
And, the least number of people are fond of either watching or participating in athletics.
View full question & answer
Question 85 Marks
The performance of a student in $1st$ Term and $2nd$ Term is given. Draw a double bar graph choosing appropriate scale and answer the question:
Subject $1^{st}$ term(M.M.$100)$ $2^{nd}$ term(M.M. $100)$
English $67$ $70$
Hindi $72$ $65$
Maths $88$ $95$
Science $81$ $85$
S. Science $73$ $75$
Has the performance gone down in any subject?
Answer
The double bar graph of the given data is shown below:

Here, we observe that,
From the given graph,
Hindi has a decrement in marks in the second term
Hence, It can be concluded that,
The child’s performance has gone down in Hindi.
View full question & answer
Question 95 Marks
The performance of a student in $1st$ Term and $2nd$ Term is given. Draw a double bar graph choosing appropriate scale and answer the question:
Subject $1^{st}$ term(M.M.$100)$ $2^{nd}$ term(M.M. $100)$
English $67$ $70$
Hindi $72$ $65$
Maths $88$ $95$
Science $81$ $85$
S. Science $73$ $75$
In which subject is the improvement the least?
Answer
As per the question:
The double bar graph of the given data is made below:

Here, we can clearly see that,
Social Science has the least increase in marks.
Hence, It can be concluded that,
The child had improved his performance the least in Social Science.
View full question & answer
Question 105 Marks
The performance of a student in $1st$ Term and $2nd$ Term is given. Draw a double bar graph choosing appropriate scale and answer the question:
Subject $1^{st}$ term(M.M.$100)$ $2^{nd}$ term(M.M. $100)$
English $67$ $70$
Hindi $72$ $65$
Maths $88$ $95$
Science $81$ $85$
S. Science $73$ $75$
In which subject, has the child improved his performance the most?
Answer
As per the question:
The double bar graph of the given data is shown as follows:

Here, we find that,
Mathematics has a maximum increase in marks.
Hence,
It can be concluded that the child has improved his performance the most in Mathematics.
View full question & answer
Question 115 Marks
The heights of $10$ girls were measured in $cm$ and the results are as follows:
$135, 150, 139, 128, 151, 132, 146, 149, 143, 141.$
$i.$ What is the height of the tallest girl?
$ii.$ What is the height of the shortest girl?
$iii.$ What is the range of the data?
$iv.$ What is the mean height of the girls?
$v.$ How many girls have heights more than the mean height.
Answer
We will arrange the data in the ascending order
Thus, the heights of the ten girls can be arranged in ascending order as follows:
$128, 132, 135, 139, 141, 143, 146, 149, 150, 151$
$i.$ Here, we have to find the height of the tallest girl mentioned in the data.
Hence,
Height of the tallest girl $= 151 \ cm$
$ii.$ Here, we have to find the height of the smallest girl mentioned in the data.
Hence,
Height of the smallest girl $= 128 \ cm$
$iii.$ Here, we have to find the range of the given data.
We know that,
Highest height of girl $= 151 \ mm$
Smallest height of girl $= 128 \ mm$
Therefore, Range $=$ highest height $-$ Smallest height $= 151 - 128 = 23 \ cm$
$iv.$ Here, we have to find the mean height of the girls
First of all we’ll find the sum of all the observations
So, we have sum of all the observations $= 135 + 150 + 139 + 128 + 151 + 132 + 146 + 149 + 143 + 141 = 1414$
Total number of observations $= 10$
Hence,
Mean height $ =\frac{\text { Sum of all observations }}{\text { Number of observations }} = \frac{1414}{10} = 141.4 \ cm$
$v.$ Here, we have to find the number of girls whose heights are greater than the mean height
There were total of five girls whose heights are greater than the mean height
These heights are as follows:
$143, 146, 149, 150$, and $151 \ cm$
View full question & answer
Question 125 Marks
The rainfall $($in $mm)$ in a city on $7$ days of a certain week was recorded as follows:
Day Mon Tues Wed Thurs Fri Sat Sun
Rainfall $($in $mm)$ $0.0$ $12.2$ $2.1$ $0.0$ $20.5$ $5.5$ $1.0$
$i.$ Find the range of the rainfall in the above data.
$ii.$ Find the mean rainfall for the week.
$iii.$ On how many days was the rainfall less than the mean rainfall
Answer
$i.$ We have to find the range of the given data.
here, Highest rainfall $= 20.5\ mm$
Lowest rainfall $= 0.0\ mm$
Thus, Range $=$ Highest value $–$ Lowest value
Hence, Range of the given data:
Range $=$ highest rainfall $–$ lowest rainfall $= 20.5 – 0.0 = 20.5 \ mm$
$ii.$ Here, We have to find the mean of the rainfall for the week
Clearly, sum of all the observations $= 0.0 + 12.2 + 2.1 + 0.0 + 20.5 + 5.5 + 1.0 = 41.3$
Also, total number of observations $= 7$
Hence,
Mean rainfall $=\frac{\text { Sum of all observations }}{\text { Number of observations }}$
$=\frac{41.3}{7} $
$= 5.9 \ mm$
$iii.$ Here, we have to find the number of days when the rainfall was less than the mean rainfall
Clearly, we can observe that,
For total five days, the rainfall was less than the mean rainfall
These days are as follows:
Monday, Wednesday, Thursday, Saturday and Sunday
View full question & answer
Question 135 Marks
The marks $($out of $100)$ obtained by a group of students in a science test are $85, 76, 90, 85, 39, 48, 56, 95, 81$ and $75.$ Find the:
$i.$ Highest and lowest marks obtained by the students.
$ii.$ Range of the marks obtained.
$iii.$ Mean marks obtained by the group.
Answer
Here, we will arrange the data in the ascending order
Thus, the marks obtained by the group of students in a science test can be arranged in an ascending order as follows:
$39, 48, 56, 75, 76, 81, 85, 85, 90, 95$
$i.$ Clearly, we can see that
Highest marks $= 95$
Lowest marks $= 39$
$ii.$ We know that,
Range $=$ Highest value $–$ Lowest value
or Range $=$ highest number $-$ lowest number$= 95 - 39 = 56$
$iii.$ Here, sum of all the observations $= 85 + 76 + 90 + 85 + 39 + 48 + 56 + 95 + 81 + 75 = 730$
Total number of observations $= 10$
Therefore,
Arithmetic mean $ =\frac{\text { sum of all observations }}{\text { Number of observations }} = \frac{730}{10} = 73$
View full question & answer
Question 145 Marks
Organise the following marks in a class assessment, in a tabular form.
$4, 6, 7, 5, 3, 5, 4, 5, 2, 6, 2, 5, 1, 9, 6, 5, 8, 4, 6, 7$
$i.$ Which number is the highest?
$ii.$ Which number is the lowest?
$iii.$ What is the range of the data?
$iv.$ Find the arithmetic mean.
Answer
We will draw the frequency table of the above given data.
Hence, we have
Marks Tally marks Frequency
$1$ $I$ $1$
$2$ $II$ $2$
$3$ $I$ $1$
$4$ $III$ $3$
$5$ $IIII$ $5$
$6$ $IIII$ $4$
$7$ $II$ $2$
$8$ $I$ $1$
$9$ $I$ $1$
$i.$ Clearly, The highest number among the given data is $9$
$ii.$ The lowest number among the given data is $1$
$iii.$ We know that,
Range $=$ Highest value $–$ Lowest value
Hence,
Range of the given data can be calculated as follows:
Range $=$ highest number $–$ lowest number $= 9 – 1 = 8$
$iv.$ Here,
We have to find the arithmetic mean of the given data
For this, We’ll find the sum of all the observations
So, Sum of all the observations $ = 4 + 6 + 7 + 5 + 3 + 5 + 4 + 5 + 2 + 6 + 2 + 5 + 1 + 9 + 6 + 5 + 8 + 4 + 6 + 7 = 100$
Also, Total number of observations $= 20$
Therefore, Arithmetic mean $=\frac{\text { Sum of all observations }}{\text { Number of observations }}$ $=\frac{100}{20} = 5$
View full question & answer
Question 155 Marks
Following data gives total marks $($out of $600)$ obtained by six children of a particular class. Represent the data on a bar graph.
Students Ajay Bali Dipti Faiyaz Geetika Hari
Marks Obtained $450$ $500$ $300$ $360$ $400$ $540$
Answer
$i.$ To choose an appropriate scale we make equal divisions taking increments of $100$. Thus $1$ unit will represent $100 $ marks.
$ii.$ Now, represent the data on the bar graph as shown in the figure below.
View full question & answer
Question 165 Marks
Two hundred students of 6th and $7th$ classes were asked to name their favourite colour so as to decide upon what should be the colour of their school building. The results are shown in the table. Represent the given data on a bar graph.
Favourite Colour Red Green Blue Yellow Orange
Number of Students $43$ $19$ $55$ $49$ $34$
Answer the question with the help of the bar graph: How many colours are there in all? What are they?
Answer


There are five colours. They are Red, Green, Blue, Yellow and Orange.
View full question & answer