Question 11 Mark
In Throwing a die the number of possible outcomes is _________.
AnswerWhen we throw a die, $6$ outcomes are possible. They are $1, 2, 3, 4, 5$ and $6.$
View full question & answer→Question 21 Mark
Classify, the following events as certain to happen, impossible to happen, may or may not happen. Getting head when a coin is tossed.
AnswerGetting head, when a coin is tossed may or may not happen as a coin has head and tail on its two faces. So, we might get a head or a tail on tossing it.
View full question & answer→Question 31 Mark
The marks in a subject for $12$ students are as follows: $31, 37, 35, 38, 42, 23, 17, 18, 35, 25, 35, 29$ For the given data, find the: Range.
AnswerGiven data is $31, 37, 35, 38, 42, 23, 17, 18, 35, 25, 35, 29.$
Rearranging the given data in ascending order, $17, 18, 23, 25, 29, 31, 35, 35, 35, 37, 38, 42$
Range $=$ Highest observation $-$ Lowest observation
$= 42 - 17 = 25$
View full question & answer→Question 41 Mark
_________ can be used to compare two collections of data.
Answer A double bar graph can be used to compare two collections of data.
View full question & answer→Question 51 Mark
The measures of central tendency may not lie between the maximum and minimum values of data.
AnswerFalse. Solution: The measures of central tendency lie between the maximum and minimum values of the data.
View full question & answer→Question 61 Mark
Range of the data is always from the data.
AnswerFalse. Solution: It is not necessary as range is the difference of highest observation and lowest observation.
View full question & answer→Question 71 Mark
Given below are heights of 15 boys of a class measured in cm:$128, 144, 146, 143, 136, 142, 138, 129, 140, 152, 144, 140, 150, 142, 154.$
Find:
The height of the shortest boy.
AnswerGiven, height (data) of $15$ boys of a class are: $128, 144, 146, 143, 136, 142, 138, 129, 140, 152, 144, 140, 150, 142, 154.$
Arranging the given data in ascending order, we have $128, 129, 136, 138, 140, 140, 142, 142, 143, 144, 144, 146, 150, 152, 154$
By observing the data, height of the shortest boy $= 128\ cm$
View full question & answer→Question 81 Mark
The data $12, 13, 14, 15, 16$ has every observation as mode.
AnswerGiven data is $12, 13, 14, 15, 16.$
Here, each observation has same frequency,
so every observation is a mode.
View full question & answer→Question 91 Mark
Mean, Median and Mode may be the same for some data.
AnswerData $($in ascending order$) → 3, 3, 4, 4, 4, 4, 6$
Here, $n = 7 ($odd$)$
Median $=$ Value of $\Big(\frac{\text{n+1}}{2}\Big)\text{th}$ observation = Value of $\Big(\frac{7+1}{2}\Big)\text{th}$
observation $= 4$
$\text{Mean}=\frac{\text{Sum of observation}}{\text{n}}$
$=\frac{3+3+4+4+4+4+6}{7}=\frac{28}{7}$
$=4$
Hence,
Mean $=$ Mode $=$ Median
Mean, median and mode can be the same for some data.
View full question & answer→Question 101 Mark
In a given data, arranged in ascending or descending order, the middle most observation is called __________.
AnswerIn a given data, arranged in ascending or descending order, the middle most observation is called Median. Solution: Median is the value of middle most observation of a given data, which arranged in ascending or descending order.
View full question & answer→Question 111 Mark
When a coin is tossed, there are $2$ possible outcomes.
AnswerIf a coin is tossed, then Maximum outcomes $= 2,$ i.e. head or tail.
View full question & answer→Question 121 Mark
Mode of the data is always from the given data.
AnswerTrue. Solution: Mode of the data is always from the given data as it is the most frequent observation in the data.
View full question & answer→Question 131 Mark
The probability of an event which is certain to happen is _________.
AnswerIn other words, probability of a sure event is $1.$
View full question & answer→Question 141 Mark
The range of the data $3, 7, 1, -2, 2, 6, -3, -5$ would change, if $8$ was added to each value in the data.
AnswerBecause, range before adding $8 =$ Maximum observation $-$ Minimum observation
$= 7 - (-5) = 7 + 5 = 12$
Data after adding 8
$= 3 + 8, 7 + 8, 1 + 8, -2 + 8, 2 + 8, 6 + 8, –3 + 8, -5 + 8, i.e. 11, 15, 9, 6, 10, 14, 5, 3$
So, the range is same. Range = Maximum observation - Minimum observation $= 15 - 3 = 12$
View full question & answer→Question 151 Mark
Rohit collected the data regarding weights of students of his class and prepared the following table:
|
Weight (in kg):
|
$44–47$
|
$48–51$
|
$52–55$
|
$56–60$
|
|
Number of Students:
|
$3$
|
$5$
|
$25$
|
$7$
|
A student is to be selected randomly from his class for some competition. The probability of selection of the student is highest whose weight is in the interval _________. AnswerWe know that,
$\text{Probability}=\frac{\text{Number of favourable outcomes}}{\text{Total number of possible outcomes}}$
$\therefore$ To make the probability highest, we have to take the interval where number of students, i.e. possible outcomes are highest.
Here, probability is highest whose weight is in the interval. Since maximum number of students i.e., $25$ lies in interval $52-55.$
View full question & answer→Question 161 Mark
Find the mode of the given data: $10, 8, 4, 7, 8, 11, 15, 8, 4, 2, 3, 6, 8$
AnswerWe know that, mode is the most frequent observation in the data.
$\therefore$ Mode $= 8$
View full question & answer→Question 171 Mark
The following are weights (in kg) of $12$ people. $70, 62, 54, 57, 62, 84, 75, 59, 62, 65, 78, 60$ Find the range of the given data.
AnswerRange $=$ Maximum observation $-$ Minimum observation $= 84 – 54 = 30$
View full question & answer→Question 181 Mark
The representation of data with bars of uniform width is called _________.
AnswerThe representation of data with bars of uniform width is called bar graph.
View full question & answer→Question 191 Mark
Classify, the following events as certain to happen, impossible to happen, may or may not happen. A team winning the match.
AnswerA team may or may not win a match.
View full question & answer→Question 201 Mark
Median of the data may or may not be from the given data.
Answer$e.g.$
$i. 2, 4, 6, 8$
Here, $n = 5($odd$)$
Median $=$ Value of $\Big(\frac{\text{n+1}}{2}\Big)^\text{th}$ observation
$=$ Value of $\Big(\frac{5+1}{2}\Big)^\text{th}$ observation
$=$ Value of $3^{rd}$ observation $= 6$
$ii. 4, 6, 8, 8, 12, 14, 15, 16$
Here, $n = 8($even$)$
Median $=\frac{\text{Value of }\Big(\frac{\text{n}}{2}\Big)^\text{th }\text{observation = Value of}\Big(\frac{\text{n}}{2}+1\Big)^\text{th }\text{observation}}{2}$
$=\frac{\text{Value of $4^{th}$ observation + Value of $5^{th}$ observation}}{2}$
$=\frac{8+12}{2}$
$=\frac{20}{2}$
$=10$
View full question & answer→Question 211 Mark
The marks in a subject for $12$ students are as follows: $31, 37, 35, 38, 42, 23, 17, 18, 35, 25, 35, 29$ For the given data, find the: Mode.
AnswerGiven data is $31, 37, 35, 38, 42, 23, 17, 18, 35, 25, 35, 29.$ Rearranging the given data in ascending order, $17, 18, 23, 25, 29, 31, 35, 35, 35, 37, 38, 42$ Mode $=$ Most frequent observation $= 35$
View full question & answer→Question 221 Mark
If the arithmetic mean of $8, 4, x, 6, 2, 7$ is $5,$ then the value of $x$ is _________.
AnswerWe know that,$\text{Mean}=\frac{\text{Sum of all observatiions}}{\text{Total number of observations}}$
$\Rightarrow5=\frac{8+4+\text{x}+6+2+7}{6} [\because$ mean $= 5,$ given$]$
$\Rightarrow30=27+\text{x}$
$\Rightarrow30-27=\text{x}$
$\Rightarrow3=\text{x}$
$\therefore\text{x}=3$
Hence, the value of $x$ is $3.$
View full question & answer→Question 231 Mark
Classify, the following events as certain to happen, impossible to happen, may or may not happen.
Christmas will be on $25$ December.
AnswerChristmas is certain to happen on $25th.$
View full question & answer→Question 241 Mark
The probability of getting an ace out of a deck of cards is greater than $1.$
AnswerProbability of an event can never be greater than $1.$
It always remains from $0$ and $1$ for any event.$0\leq\text{P(E)}\leq1$
$\therefore$ Maximum probability can be $1.$
View full question & answer→Question 251 Mark
The probability of an event which is impossible to happen is __________.
AnswerThe probability of an event which is impossible to happen is 0. Solution: Probability of an impossible event is 0. As impossible events are those which cannot happen.
View full question & answer→Question 261 Mark
What is the probability of the sun setting tomorrow$?$
AnswerSetting of the sun is a sure event. Hence, its probability is $1$
View full question & answer→Question 271 Mark
It is impossible to get a sum of $14$ of the numbers on both die, when a pair of dice is thrown together.
AnswerWhen a die is thrown, maximum possible outcomes are $6,$ i.e. $1, 2, 3, 4, 5, 6.$
So, when a pair of dice is thrown together,
maximum sum will be $12,$ if and only if both dice get 6 together.
So, that pair will be $(6, 6)$ and the sum is $12.$
$\therefore$ It is impossible to get a sum of $14$ on both dice, when a pair of dice is thrown together.
View full question & answer→Question 281 Mark
Classify, the following events as certain to happen, impossible to happen, may or may not happen. A ball thrown up in the air will fall down after sometime.
AnswerIt is certain to happen that a ball thrown up in the air will fall down after sometime due to gravity
View full question & answer→Question 291 Mark
Classify, the following events as certain to happen, impossible to happen, may or may not happen. Getting a number less than $1$ on throwing a die.
AnswerGetting a number less than 1 on throwing a die is impossible, as a die does not have a number less than 1 on it.
View full question & answer→Question 301 Mark
Classify, the following events as certain to happen, impossible to happen, may or may not happen. Today moon will not revolve around the earth.
AnswerIt is impossible that moon will not revolve around the earth.
View full question & answer→Question 311 Mark
If the extreme observations of both the ends of a data arranged in ascending order are removed, the median gets affected.
AnswerFalse. Solution: If the extreme observations on both the ends of a data arranged in ascending order are removed, then the mean and mode gets affected but median remains same.
View full question & answer→Question 321 Mark
Mean, median and mode are the measures of __________.
Answer Mean, median and mode are the measures of central tendency.
View full question & answer→Question 331 Mark
Mean of the observations can be lesser than each of the observations.
Answer False.
Solution:
Mean is the average value of all the observations. Some of the observations are less than it and some of observations are more than it.
View full question & answer→Question 341 Mark
The mean of a data is defined as__________.
Answer The mean of a data is defined as $\frac{\text{Sum of all observations}}{\text{Number of observations}}$.
View full question & answer→Question 351 Mark
A coin is tossed $15$ times and the outcomes are recorded as follows: $\text{H T T H T H H H T T H T H T T.}$ The chance of occurence of a head is $50$ percent.
AnswerNumber of times in which head occurs $= 7$
Total number of times, the coin is tossed $= 15$
$\therefore$ Probability of getting a head $=\frac{7}{15}$
View full question & answer→Question 361 Mark
Mode of the data is always from the given data.
AnswerFalse. Solution: It is not compulsory that mean of the data is always from the given data. It may or may not be the observation from given data.
View full question & answer→Question 371 Mark
Given below are heights of $15$ boys of a class measured in cm:$128, 144, 146, 143, 136, 142, 138, 129, 140, 152, 144, 140, 150, 142, 154.$
Find:
The height of the tallest boy.
AnswerGiven, height (data) of $15$ boys of a class are: $128, 144, 146, 143, 136, 142, 138, 129, 140, 152, 144, 140, 150, 142, 154.$
Arranging the given data in ascending order, we have $128, 129, 136, 138, 140, 140, 142, 142, 143, 144, 144, 146, 150, 152, 154$ By observing the data,
height of the tallest boy $= 154\ cm$
View full question & answer→Question 381 Mark
In a set of observations, the observation that occurs the most often is called __________.
AnswerIn a set of observations, the observation that occurs the most often is called Mode. Solution: Mode is the most often occurring observation in a set of data.
View full question & answer→Question 391 Mark
Mean can never be a fraction.
Answere.g. Mean between $\frac{1}{4}$ and $\frac{1}{6}$
$=\frac{\text{Sum of}\frac{1}{4}\text{and}\frac{1}{6}}{\text{n}}=\frac{\frac{1}{4}+\frac{1}{6}}{2}$
$[\because ($number of terms$) = 2$
$=\frac{\frac{6+4}{24}}{2}=\frac{10}{24}\times\frac{1}{2}=\frac{5}{24}$
View full question & answer→Question 401 Mark
Observe the data and answer the questions that follow: $16, 15, 16, 16, 8, 15, 17$ Atleast how many and which value(s) must be put into change the mode to $15?$
AnswerAtleast two $15’s$ should be added to change the mode to $15.$ On adding two $15’s$ the frequency of $15$ will be maximum, i.e. $4.$
View full question & answer→Question 411 Mark
The median of any data lies between the ______ add ___________ observations.
AnswerThe median of any data lies between the minimum add maximum observations.
View full question & answer→Question 421 Mark
When a die is thrown, the probability of getting a number less than $7$, is __________.
AnswerWhen we throw a die, 6 outcomes are possible, $i.e. 1, 2, 3, 4, 5, 6.$ Total outcomes $= 6$
Possible outcomes less than $7 = 6 [\because$ all the outcomes are less than $7]\because\text{Probability}=\frac{\text{Possible outcomes}}{\text{Total outcomes}}=\frac{6}{6}=1$
View full question & answer→Question 431 Mark
The difference between the highest and the lowest observations of a data is called _________.
AnswerThe difference between the highest and the lowest observations of a data is called range.
View full question & answer→Question 441 Mark
Observe the data and answer the questions that follow: $16, 15, 16, 16, 8, 15, 17$ Which data value can be put in the data so that the mode remains
the same$?$
AnswerGiven data: $16, 15, 16, 16, 8, 15, 17$ Arranging the given data in ascending order, we have $8, 15, 15, 16, 16, 16, 17$ As per the given data, $16$ is the mode of data, since it has highest frequency, i.e. $3$. Now, if $15$ is added to the given data, mode will get changed to $15$ and $16,$ whereas if any other number, i.e. $8, 16$ or $17$ is added, mode will remain same.
View full question & answer→Question 451 Mark
Observe the data and answer the questions that follow: $16, 15, 16, 16, 8, 15, 17$ What is the least number of data values that must be put into change the mode to $17?$ Name them.
AnswerWe will have to add atleast three $17’s$ to change the mode to $17.$ On adding three $17’s,$ the frequency of $17$ will be maximum, i.e. $4.$
View full question & answer→Question 461 Mark
If a die is thrown, the probability of getting a number greater than $6$ is $1.$
AnswerAs we know, a die has six numbers on it, i.e. $1$ to $6$. So, it is impossible to get a number greater than $6.$ Hence, if a die is thrown, the probability of getting a number greater than $6$ is $0.$
View full question & answer→Question 471 Mark
Median is one of the observations in the data, if number of observations is ____.
AnswerIf number of observation $(n)$ is odd, then median is one of the observation in the data. Note
Case I If $n =$ odd Median = Value of $\Big(\frac{\text{n+1}}{2}\Big)\text{th}$ observation
Case II If $n =$ even, Median $=\frac{\text{Value of }\Big(\frac{\text{n}}{2}\Big)\text{th observation + Value of }\Big(\frac{\text{n}}{2}+1\Big)\text{th observation}}{2}$
View full question & answer→Question 481 Mark
A data constitutes of heights (in cm) of 50 children. What do you understand by mode for the data?
AnswerSince, mode is the observation that occurs most frequently in a set of observation.
View full question & answer→Question 491 Mark
The probability of the spinning arrow stopping in the shaded region figure is $\frac{1}{2}.$
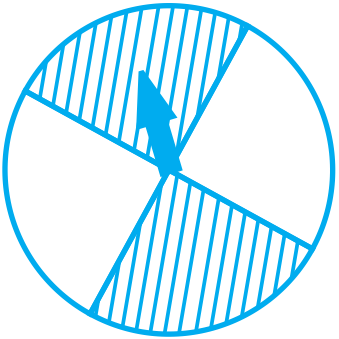
AnswerFavourable outcomes $=$ Number of shaded regions $= 2$
Total number of possible outcomes $=$ Total number of regions $= 4$
$\therefore\text{Probability}=\frac{\text{Favourable outcomes}}{\text{Total number of possible outcomes}}=\frac{2}{4}=\frac{1}{2}$
View full question & answer→Question 501 Mark
The following are weights (in kg) of $12$ people. $70, 62, 54, 57, 62, 84, 75, 59, 62, 65, 78, 60$ How many people weight above the mean weight$?$
AnswerWeights above $65.66$ are $70, 84, 75$ and $78,$ i.e. $4$ persons.
View full question & answer→Question 511 Mark
The range of the data $2, -5, 4, 3, 7, 6$ would change, if $2$ was subtracted from each value in the data.
AnswerRange before subtraction by $2 =$ Highest observation $-$ Lowest observation $= 7 - (-5) = 7 + 5 = 12$
Data after subtract by $2 = 2 -2, -5 - 2, 4 - 2, 3 -2, 7 - 2, 6 - 2,$ i.e. $0, -7, 2, 1, 5, 4$
Range $=$ Highest observation $-$ Lowest observation $= 5 - (-7) = 5 + 7 = 12$
So, the range is same.
View full question & answer→Question 521 Mark
Given below are heights of $15$ boys of a class measured in cm$:128, 144, 146, 143, 136, 142, 138, 129, 140, 152, 144, 140, 150, 142, 154.$
Find:
The range of the given data.
AnswerGiven, height (data) of $15$ boys of a class are: $128, 144, 146, 143, 136, 142, 138, 129, 140, 152, 144, 140, 150, 142, 154.$
Arranging the given data in ascending order, we have $128, 129, 136, 138, 140, 140, 142, 142, 143, 144, 144, 146, 150, 152, 154$
Here, highest observation $= 154$ and lowest observation $= 128$
$\therefore$ Range = Highest observation - Lowest observation $= 154 - 128 = 26\ cm$
View full question & answer→