Sample QuestionsData Handling questions
One sample from each question group in this chapter. Select any group above to see the full set with answer keys.
In a school, only $2$ out of $5$ students can participate in a quiz. What is the chance that a student picked at random makes it to the competition?
Answer: B.
View full solution →There are $2$ aces in each of the given set of cards placed face down. From which set are you certain to pick the two aces in the first go?
Answer: C.
View full solution →Which of the following has the same mean, median and mode?
- A
$6, 2, 5, 4, 3, 4, 1$
- B
$4, 2, 2, 1, 3, 2, 3$
- C
$2, 3, 7, 3, 8, 3, 2$
- ✓
$4, 3, 4, 3, 4, 6, 4$
Answer: D.
View full solution →The mean of three numbers is $40$. All the three numbers are different natural numbers. If lowest is $19$, what could be highest possible number of remaining two numbers?
Answer: A.
View full solution →The range of the data : $21, 6, 17, 18, 12, 8, 4, 13$ is:
Answer: A.
View full solution →In Throwing a die the number of possible outcomes is _________.
Classify, the following events as certain to happen, impossible to happen, may or may not happen. Getting head when a coin is tossed.
The marks in a subject for $12$ students are as follows: $31, 37, 35, 38, 42, 23, 17, 18, 35, 25, 35, 29$ For the given data, find the: Range.
View full solution → _________ can be used to compare two collections of data.
The measures of central tendency may not lie between the maximum and minimum values of data.
Find the mean of first six multiples of $4.$
View full solution →The marks in a subject for $12$ students are as follows: $31, 37, 35, 38, 42, 23, 17, 18, 35, 25, 35, 29$ For the given data, find the: Mean.
View full solution →The marks in a subject for $12$ students are as follows: $31, 37, 35, 38, 42, 23, 17, 18, 35, 25, 35, 29$ For the given data, find the: Median.
View full solution →Given below are heights of $15$ boys of a class measured in cm: $128, 144, 146, 143, 136, 142, 138, 129, 140, 152, 144, 140, 150, 142, 154.$
Find:
The median height of the boy.
View full solution → When a spinner with three colours given in figure is rotated, which colour has more chance to show up with arrow than the others? 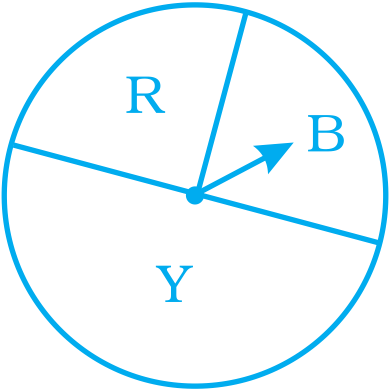
The following table shows the average intake of nutrients in calories by rural and urban groups in a particular year. Using a suitable scale for the given data, draw a double bar graph to compare the data.
|
Foodstuff
|
Rural
|
Urban
|
|
Pulses
|
$35$
|
$49$
|
|
Leafy vegetables
|
$14$
|
$21$
|
|
Other vegetables
|
$51$
|
$89$
|
|
Fruits
|
$35$
|
$66$
|
|
Milk
|
$70$
|
$250$
|
|
Fish and flesh foods
|
$10$
|
$22$
|
|
Fats and Oils
|
$9$
|
$35$
|
|
Sugar/ Jaggery
|
$19$
|
$31$
|
View full solution →Observe the given bar graph carefully and answer the questions that follow.
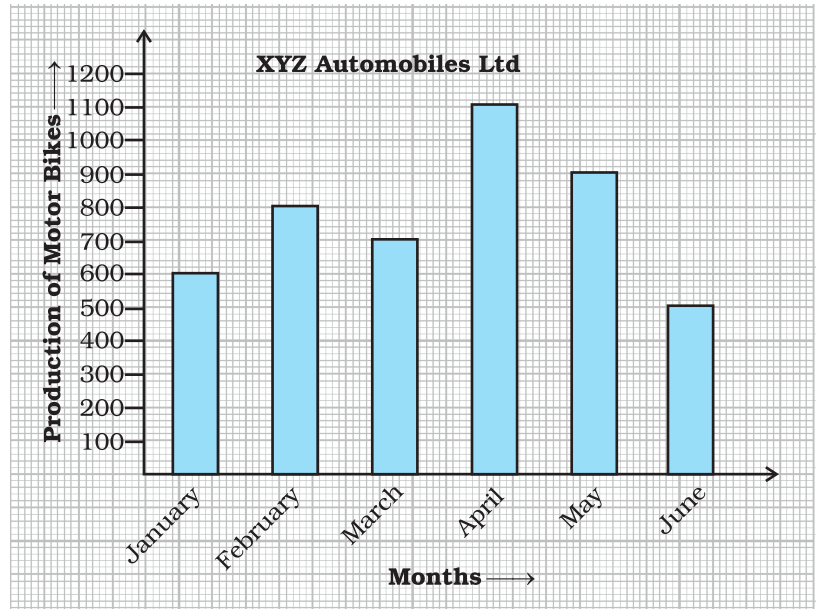
$a.$ What information does the bar graph depict?
$b.$ How many motor bikes were produced in the first three months?
$c.$ Calculate the increase in production in May over the production in January.
$d.$ In which month the production was minimum and what was it?
$e.$ Calculate the average $($mean$)$ production of bikes in $6$ months. View full solution →Study the bar graph given below and answer the questions that follow.
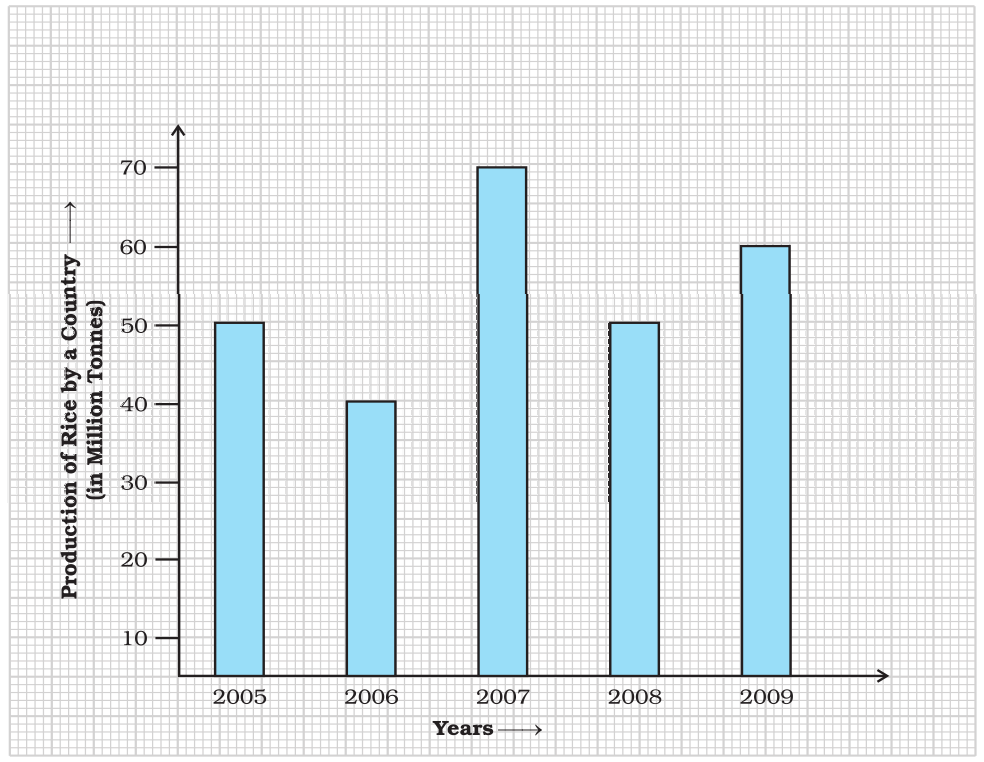
$a.$ What information does the above bar graph represent?
$b.$ In which year was production the least?
$c.$ After which year was the maximum rise in the production?
$d.$ Find the average production of rice during the $5$ years.
$e.$ Find difference of rice production between years $2006$ and $2008.$ View full solution →The bar graph given below represents the circulation of newspapers $($dailies$)$ in a town in six languages $($the figures are approximated to hundreds$).$
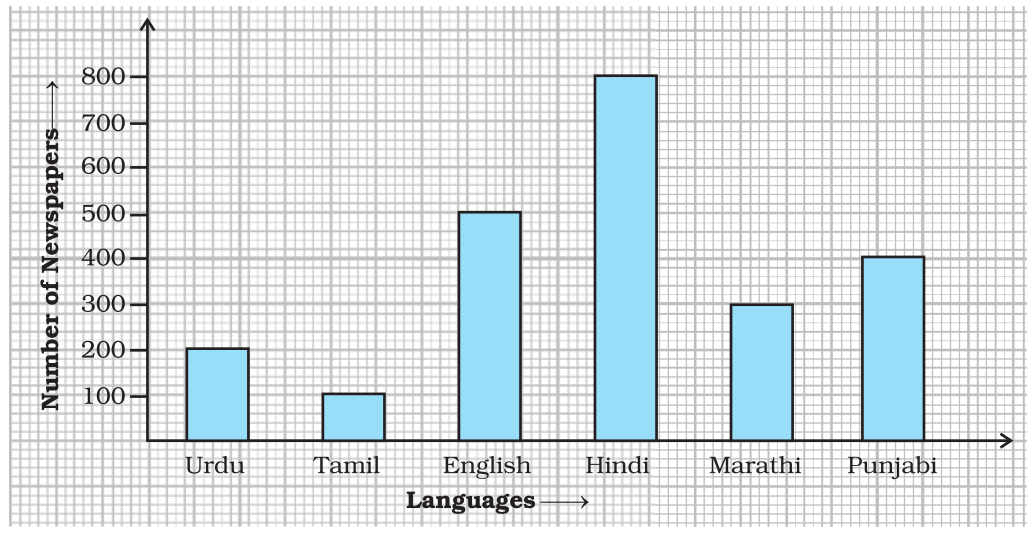
Study the bar graph and answer the following questions:
$a.$ Find the total number of newspapers read in Hindi, Punjabi, Urdu, Marathi and Tamil.
$b.$ Find the excess number of newspapers read in Hindi than those in English.
$c.$ Name the language in which the least number of newspapers are read.
$d.$ Write the total circulation of newspapers in the town. View full solution →The table below gives the data of tourists visiting $5$ hill stations over two consecutive years. Study the table and answer questions that follow:
|
Hills
|
Nanital
|
Shimla
|
Manali
|
Mussorie
|
Kullu |
|
$2008$
|
$4000$
|
$5200$
|
$3700$
|
$5800$
|
$3500$ |
|
$2009$
|
$4800$
|
$4500$
|
$4200$
|
$6200$
|
$4600$ |
$a.$ Draw a double bar graph to depict the above information using appropriate scale.
$b.$ Which hill station was visited by the maximum number of tourists in $2008?$
$c.$ Which hill station was visited by least number of tourists in $2009?$
$d.$ In which hill stations was there increase in number of tourists in $2009?$ View full solution →Following cards are put facing down:
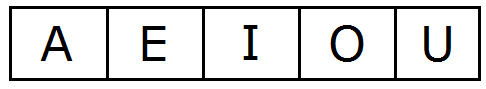
What is the chance of drawing out
- a vowel
- a card marked $U$
- $A$ or $I$
- a consonant
View full solution →Age (in years) of $6$ children of two groups are recorded as below:
|
Age (in Years)
|
|
Group A
|
Group B
|
|
$7$
|
$7$
|
|
$7$
|
$9$
|
|
$9$
|
$11$
|
|
$8$
|
$12$
|
|
$10$
|
$12$
|
|
$10$
|
$12$
|
- Find the mode and range for each group.
- Find the range and mode if the two groups are combined together.
View full solution →For the given data below, calculate the mean of its median and mode
$6, 2, 5, 4, 3, 4, 4, 2, 3$
View full solution →A die was thrown $15$ times and the outcomes recorded were $5, 3, 4, 1, 2, 6, 4, 2, 2, 3, 1, 5, 6, 1, 2.$ Find the mean, median and mode of the data.
View full solution →A car seller collects the following data of cars sold in his shop.
|
Colour of Car
|
Number of Cars Sold
|
|
Red
|
$15$
|
|
Black
|
$20$
|
|
White
|
$17$
|
|
Silver
|
$12$
|
|
Others
|
$9$
|
- Which colour of the car is most liked$?$
- Which measure of central tendency was used in $(a)?$
View full solution →