Question types

Introduction to Graphs question types

90 questions across 6 question groups — pick any mix to generate a Maths paper with step-by-step answer keys.

90
Questions
6
Question groups
5
Question types
Sample Questions

Introduction to Graphs questions

One sample from each question group in this chapter. Select any group above to see the full set with answer keys.

The point $(3, 4)$ is at a distance of:
  • A
    $3$ from both the axis.
  • B
    $4$ from both the axis.
  • $4$ from the $x$ axis and $3$ from $y$ axis.
  • D
    $3$ from $x$ axis and from $y$ axis.

Answer: C.

View full solution
Data was collected on a student’s typing rate and graph was drawn as shown below. Approximately how many words had this student typed in $30$ seconds$?$
  • A
    $20$
  • B
    $24$
  • $28$
  • D
    $34$

Answer: C.

View full solution
Extend the line segment on both sides to meet the coordinate axes. What are the coordinates of the points where this line meets the $x$ -axis and the $y$-axis?
View full solution
Ajita starts off from home at $07.00$ hours with her father on a scooter that goes at a uniform speed of $30\ km/h$ and drops her at her school after half an hour. She stays in the school till $13.30$ hours and takes an auto rickshaw to return home. The rickshaw has a uniform speed of $10\ km/h$. Draw the graph for the above situation and also determine the distance of Ajita’s school from her house.
View full solution
Complete the given tables and draw a graph for each.
$a.$
$x$
$0$
$1$
$2$
$3$
$y = 3x + 1$
$1$
$4$
$-$
$-$
$b.$
$x$
$1$
$2$
$4$
$6$
$y = x - 1$
$0$
$-$
$-$
$-$
View full solution
As part of his science project, Prithvi was supposed to record the temperature every hour one Saturday from $6\ am$ to midnight. At noon, he was taking lunch and forgot to record the temperature. At $8:00\ pm$, his favourite show came on and so forgot again. He recorded the data so collected on a graph sheet as shown below.

$a.$ Why does it make sense to connect the points in this situation?
$b.$ Describe the overall trend, or pattern, in the way the temperature changes over the time period shown on the graph.
$c.$ Estimate the temperature at noon and $8 \ pm.$
View full solution
Q 103 Marks Question3 Marks
Plot the given points on a graph sheet and check if the points lie on a straight line. If not, name the shape they form when joined in the given order. $(1, 2), (2, 4), (3, 6), (4, 8)$
View full solution
Q 113 Marks Question3 Marks
Locate the points $A(1, 2), B (3, 4)$ and $C (5, 2)$ on a graph sheet taking suitable axes. Write the coordinates of the fourth point $D$ to complete the rhombus $ABCD.$ Measure the diagonals of this rhombus and find whether they are equal or not.
View full solution
The following graph shows the change in temperature of a block of ice when heated. Use the graph to answer the following questions:
$a.$ For how many seconds did the ice block have no change in temperature?
$b.$ For how long was there a change in temperature?
$c.$ After how many seconds of heating did the temperature become constant at $0^\circ\ C$?
$d.$ What was the temperature after $25$ seconds?
$e.$ What will be the temperature after $1.5$ minutes? Justify your answer.
View full solution
The cost of a note book is $Rs.10.$ Draw a graph after making a table showing cost of $2, 3, 4, .... $ note books. Use it to find
$a.$ the cost of $7$ notebooks.a
$b.$ The number of note books that can be purchased with $Rs.50$.
View full solution
Sonal and Anmol made a sequence of tile designs from square white tiles surrounding one square purple tile. The purple tiles come in many sizes. Three of the designs are shown below.
$a.$ Copy and complete the table
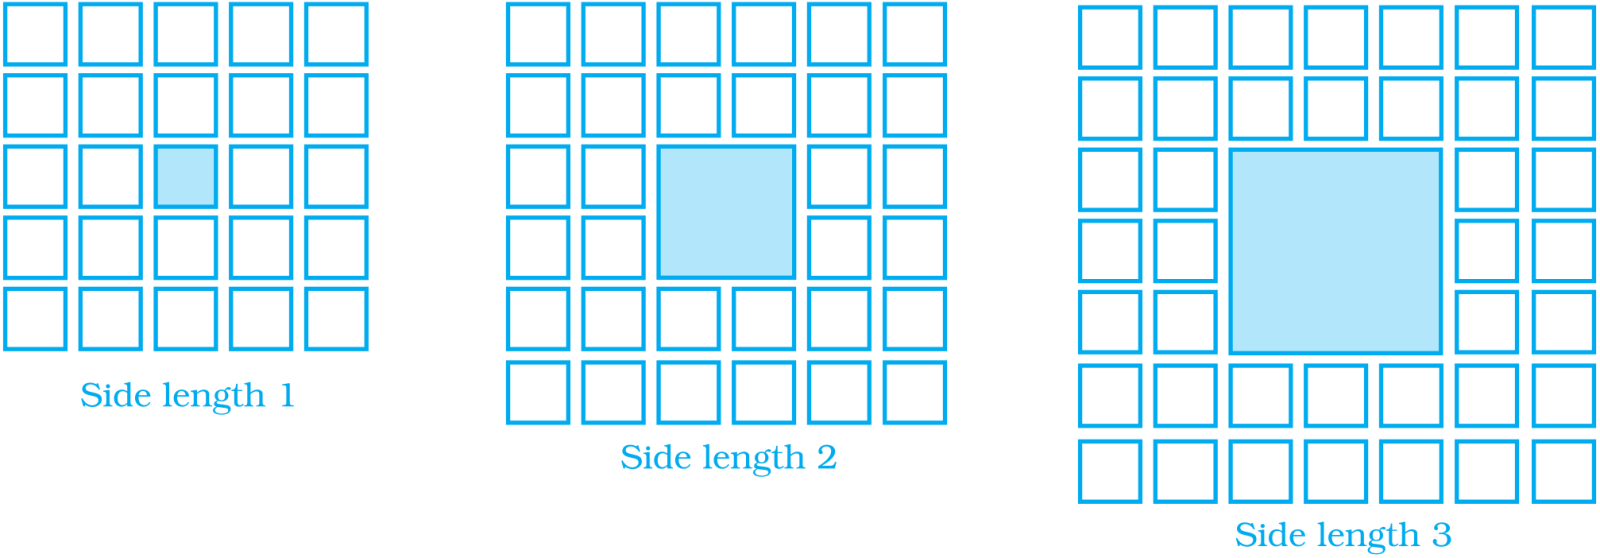
Side Length of Purple
$1$
$2$
$3$
$4$
$5$
$10$
$100$
Number of white Tiles in Border
             

$b.$ Draw a graph using the first five pairs of numbers in your table.
$c.$ Do the points lie on a line?
View full solution
Draw a parallelogram $ABCD$ on a graph paper with the coordinates given in Table $I.$ Use this table to complete Tables $II$ and $III$ to get the coordinates of $E, F, G, H$ and $J, K, L, M$.
Table $I$
point
$(x, y)$
$A$
$(1, 1)$
$B$
$(4, 4)$
$C$
$(8, 4)$
$D$
$(5, 1)$
Table $II$
point
$(0.5x, 0.5y)$
$E$
$(0.5, 0.5)$
$F$
 
$G$
 
$H$
 
Table $III$
point
$(2x, 1.5y)$
$J$
$(2, 1.5)$
$K$
 
$L$
 
$M$
 
Draw parallelograms $EFGH$ and $JKLM$ on the same graph paper. Plot the points $(2, 4)$ and $(4, 2)$ on a graph paper, then draw a line segment joining these two points.
View full solution
The following chart gives the growth in height in terms of percentage of full height of boys and girls with their respective ages.
Age $($in years$)$ $8$ $9$ $10$ $11$ $12$ $13$ $14$ $15$ $16$ $17$ $18$
Boys $72\%$ $75\%$ $78\%$ $81\%$ $84\%$ $88\%$ $92\%$ $95\%$ $98\%$ $99\%$ $100\%$
Girls $77\%$ $81\%$ $84\%$ $88\%$ $91\%$ $95\%$ $98\%$ $99\%$ $99.5\%$ $100\%$ $100\%$
Draw the line graph of above data on the same sheet and answer the following questions.
$a.$ In which year both the boys and the girls achieve their maximum height?
$b.$ Who grows faster at puberty $(14$ years to $16$ years of age$)?$
View full solution

Generate a Introduction to Graphs paper free

Pick question groups from the list above, set marks and difficulty, and export a branded PDF with step-by-step answer keys. First 3 chapters free — no signup.

Download App