Question 15 Marks
The following graph shows the change in temperature of a block of ice when heated. Use the graph to answer the following questions: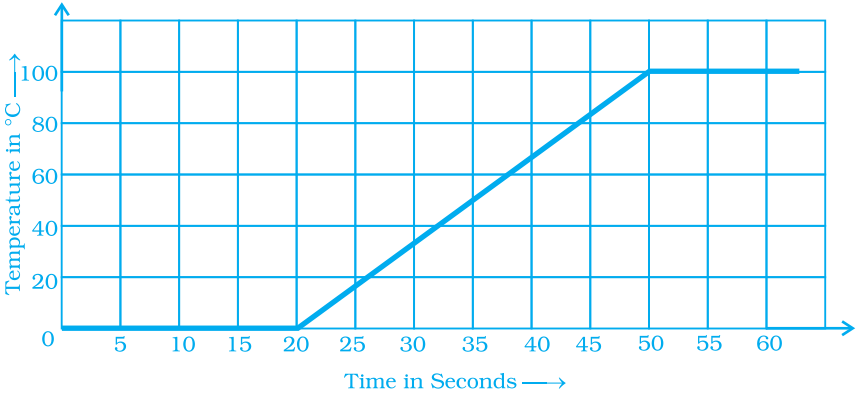
$a.$ For how many seconds did the ice block have no change in temperature?
$b.$ For how long was there a change in temperature?
$c.$ After how many seconds of heating did the temperature become constant at $0^\circ\ C$?
$d.$ What was the temperature after $25$ seconds?
$e.$ What will be the temperature after $1.5$ minutes? Justify your answer.
Answer
View full question & answer→$a.$ In the first $20\ s$, the ice block have no change in temperature.
$b.$ There was a change in temperature from $20s$ to $50 s,$
i.e. $50 - 20 = 30s.$
$c.$ Observing the graph, we see that after $50s$ of heating the temperature became constant.
$d. 20^\circ C$ was the temperature after $25s$.
$e.$ Since, the temperature became constant at $100^\circ C$ after $50\ s$ heating, so the temperature will be $100^\circ C$ even after $1.5$ min.
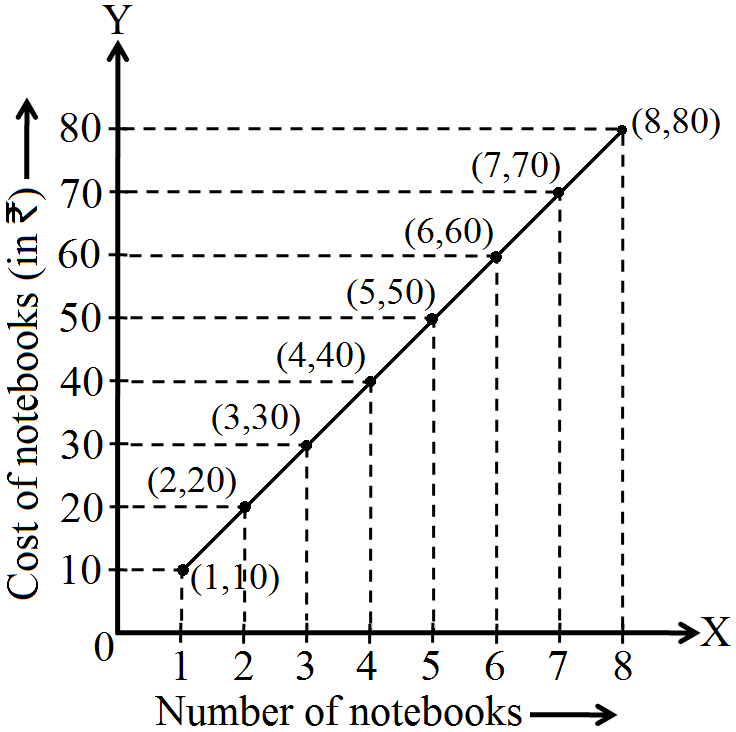
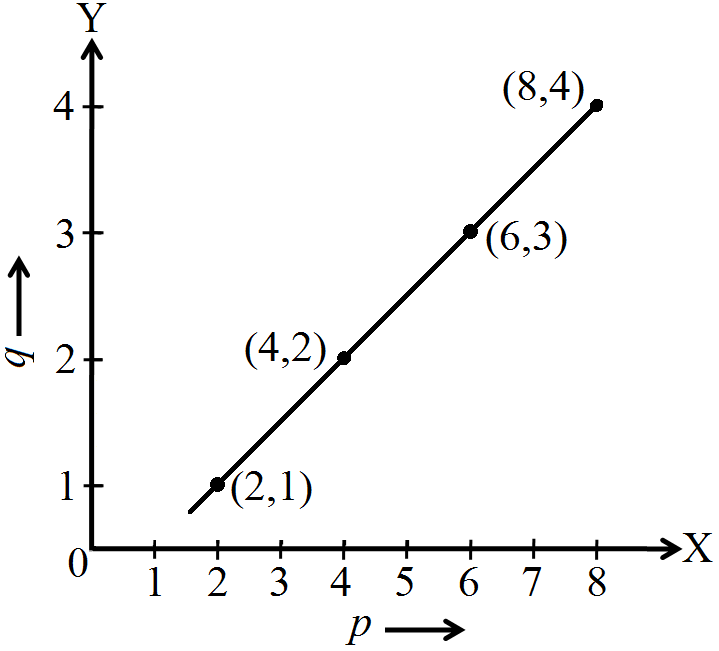 $a.$ When $q = 3$, the value of $p$ is $6$.