Sample QuestionsStatistics questions
One sample from each question group in this chapter. Select any group above to see the full set with answer keys.
The mean of $100$ items was found to be $64$. Later on it was discovered that two items were misread as $26$ and $9$ instead of $36$ and $90$ respectively. The correct mean is:
- ✓
$64.91$
- B
$65.31$
- C
$64.61$
- D
$64.86$
Answer: A.
View full solution →A grouped frequency distribution table with classes of equal sizes using $63-72 (72$ included$)$ as one of the class is constructed for the following data $30, 32, 45, 54, 74, 78, 108, 112, 66, 76, 88, 40, 14, 20, 15, 35, 44, 66, 75, 84, 95, 96, 102, 110, 88, 74, 112, 14, 34, 44.$ How many classes can we have$?$
Answer: C.
View full solution →The class mark of the class $90-120$ is:
Answer: D.
View full solution →The mean of $100$ items was found to be $64.$ Later on it was discovered that two items were misread as $26$ and $9$ instead of $36$ and $90$ respectively. The correct mean is:
- A
$64.86$
- B
$65.31$
- ✓
$64.91$
- D
$64.61$
Answer: C.
View full solution →For which set of data does the median equal the mode$?$
- ✓
$3, 3, 4$
- B
$3, 3, 4, 5$
- C
$3, 4, 5, 6, 6$
- D
$3, 3, 4, 5, 6$
Answer: A.
View full solution →Directions: In the following questions, the Assertions $(A)$ and Reason $(s)(R)$ have been put forward. Read both the statements carefully and choose the correct alternative from the following:
Assertion: $2, 4, 6$ here median is the $4$
Reason: $2, 4, 6, 8$ here median is the $5$
- A
Both Assertion and reason are correct and reason is correct explanation for Assertion.
- ✓
Both Assertion and reason are correct but reason is not correct explanation for Assertion.
- C
Assertion is correct but reason is false.
- D
Both Assertions and reason are false.
Answer: B.
View full solution →Directions: In the following questions, the Assertions $(A)$ and Reason(s) $(R)$ have been put forward. Read both the statements carefully and choose the correct alternative from the following: Assertion: The mode of below data is:
|
Class interval
|
$3-6$
|
$6-9$
|
$9-12$
|
$12-15$
|
$15-18$
|
$18-21$
|
$21-24$
|
|
Frequency
|
$2$
|
$5$
|
$10$
|
$23$
|
$21$
|
$12$
|
$3$
|
Reason: The value of the variable which occurs minimum often is the mode. - A
Both Assertion and reason are correct and reason is correct explanation for Assertion.
- B
Both Assertion and reason are correct but reason is not correct explanation for Assertion.
- ✓
Assertion is correct but reason is false.
- D
Both Assertions and reason are false.
Answer: C.
View full solution →Directions: In the following questions, the Assertions $(A)$ and Reason(s) $(R)$ have been put forward. Read both the statements carefully and choose the correct alternative from the following:
Assertion: The median of the following observation $0, 1, 2, 3, x , x + 2, 8, 9, 11, 12$ arranged in ascending order is $63,$ then the value of $x$ is $62.$
Reason: Median of n even observations is $\frac{\big(\frac{\text{n}}{2}\big)^{\text{th}}\text{term}+\Big(\frac{\text{n}}{2}+1\Big)^{\text{th}}\text{term}}{2}$
- ✓
Both assertion and reason are true and reason is the correct enatixplaon of assertion.
- B
Both assertion and reason are true but reason is not the correct explanation of assertion.
- C
Assertion is true but reason is false.
- D
Assertion is false but reason is true.
Answer: A.
View full solution →Directions: In the following questions, the Assertions $(A) $and Reason(s) $(R)$ have been put forward. Read both the statements carefully and choose the correct alternative from the following:
Assertion: $13, 13, 13, 13, 14, 14, 16, 18, 21$ here range is $8$
Reason: $1, 2, 4, 7$ here range is $6$
- A
Both Assertion and reason are correct and reason is correct explanation for Assertion.
- ✓
Both Assertion and reason are correct but reason is not correct explanation for Assertion.
- C
Assertion is correct but reason is false.
- D
Both Assertions and reason are false.
Answer: B.
View full solution →Directions: In the following questions, the Assertions $(A)$ and Reason(s) $(R)$ have been put forward. Read both the statements carefully and choose the correct alternative from the following:
Assertion: The median and mode of a frequency distribution are $150$ and $154$ respectively, then its mean is $148.$
Reason: Mean, median and mode of a frequency distribution are related as: mode $= (3$ median$) – ($2 mean$).$
- ✓
Both Assertion and reason are correct and reason is correct explanation for Assertion.
- B
Both Assertion and reason are correct but reason is not correct explanation for Assertion.
- C
Assertion is correct but reason is false.
- D
Both Assertions and reason are false.
Answer: A.
View full solution →Find the mode of the following marks $($out of $10)$ obtained by $20$ students. $4, 6, 5, 9, 3, 2, 7, 7, 6, 5, 4, 9, 10, 10, 3, 4, 7, 6, 9, 9$
View full solution →Let us now consider the following frequency distribution table which gives the weights of $38$ students of a class:
| Weights (in kg) |
Number of students |
| $31-35$ |
$9$ |
| $36-40$ |
$5$ |
| $41-45$ |
$14$ |
| $46-50$ |
$3$ |
| $51-55$ |
$1$ |
| $56-60$ |
$2$ |
| $61-65$ |
$2$ |
| $66-70$ |
$1$ |
| $71-75$ |
$1$ |
| Total |
$38$ |
Now, if two new students of weights $35.5 \ kg$ and $40.5 \ kg$ are admitted in this class, then in which interval will we include them. Create a frequency distribution table for this class interval. View full solution →$100$ plants each were planted in $100$ schools during Van Mahotsava. After one month, the number of plants that survived were recorded as : $95, 67, 28, 32, 65, 65, 69, 33, 98, 96, 76, 42, 32, 38, 42, 40, 40, 69, 95, 92, 75, 83, 76, 83, 85, 62, 37, 65, 63, 42, 89, 65, 73, 81, 49, 52, 64, 76, 83, 92, 93, 68, 52, 79, 81, 83, 59, 82, 75, 82, 86, 90, 44, 62, 31, 36, 38, 42, 39, 83, 87, 56, 58, 23, 35, 76, 83, 85, 30, 68, 69, 83, 86, 43, 45, 39, 83, 75, 66, 83, 92, 75, 89, 66, 91, 27, 88, 89, 93, 42, 53, 69, 90, 55, 66, 49, 52, 83, 34, 36$
Create a frequency distribution table with tally number.
View full solution →Consider the marks obtained (out of $100$ marks) by $30$ students of Class $IX$ of a school and create a frequency distribution table: $10, 20, 36, 92, 95, 40, 50, 56, 60, 70, 92, 88, 80, 70, 72, 70, 36, 40, 36, 40, 92, 40, 50, 50, 56, 60, 70, 60, 60, 88$
View full solution →The points scored by a Kabaddi team in a series of matches are as follows:
$17, 2, 7, 27, 15, 5, 14, 8, 10, 24, 48, 10, 8, 7, 18, 28$
Find the median of the points scored by the team.
View full solution →The heights (in cm) of $9$ students of a class are as follows:
$155, 160, 145, 149, 150, 147, 152, 144, 148$
Find the median of this data.
View full solution →In a particular section of Class $IX, 40$ students were asked about the months of their birth and the following graph was prepared for the data so obtained:
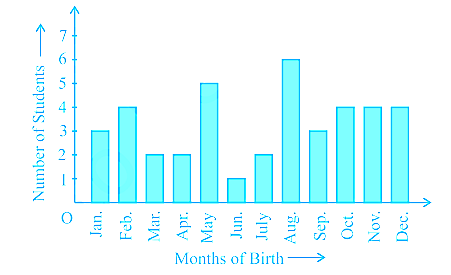
Observe the bar graph given above and answer the following questions:
$i.$ How many students were born in the month of November?
$ii.$ In which month were the maximum number of students born? View full solution →Consider a small unit of a factory where there are $5$ employees : a supervisor and four labourers. The labourers draw a salary of $₹ 5,000$ per month each while the supervisor gets $₹15,000 $ per month. Calculate the mean, median and mode of the salaries of this unit of the factory.
View full solution →Form the frequency distribution table and Find the mean of the marks obtained by $30$ students of Class $IX$ of a school, as given below:
$10, 20, 36, 92, 95, 40, 50, 56, 60, 70, 92, 88, 80, 70, 72, 70, 36, 40, 36, 40, 92, 40, 50, 50, 56, 60, 70, 60, 60, 88$
View full solution →$100$ surnames were randomly picked up from a local telephone directory and a frequency distribution of the number of letters in the English alphabets in the surnames was found as follows :
| Number of letters |
Number of surnames |
| $1-4$ |
$6$ |
| $4-6$ |
$30$ |
| $6-8$ |
$44$ |
| $8-12$ |
$16$ |
| $12-20$ |
$4$ |
$i.$ Draw a histogram to depict the given information.
$ii.$ Write the class interval in which the maximum number of surnames lie. View full solution →A random survey of the number of children of various age groups playing in a park was found as follows
| Age (in years) |
Number of children |
| $1-2$ |
$5$ |
| $2-3$ |
$3$ |
| $3-5$ |
$6$ |
| $5-7$ |
$12$ |
| $7-10$ |
$9$ |
| $10-15$ |
$10$ |
| $15-17$ |
$4$ |
Draw a histogram to represent the data above. View full solution →The runs scored by two teams $A$ and $B$ on the first $60$ balls in a cricket match are given below :
| Number of balls |
Team A |
Team B |
| $1-6$ |
$2$ |
$5$ |
| $7-12$ |
$1$ |
$6$ |
| $13-18$ |
$8$ |
$2$ |
| $19-24$ |
$9$ |
$10$ |
| $25-30$ |
$4$ |
$5$ |
| $31-36$ |
$5$ |
$6$ |
| $37-42$ |
$6$ |
$3$ |
| $43-48$ |
$10$ |
$4$ |
| $49-54$ |
$6$ |
$8$ |
| $55-60$ |
$2$ |
$10$ |
Represent the data of both the teams on the same graph by frequency polygons.
[Hint: First make the class intervals continuous.] View full solution →The following table gives the distribution of students of two sections according to the marks obtained by them:
| Section A |
Section B |
| Marks |
Frequency |
Marks |
Frequency |
| $0-10$ |
$3$ |
$0-10$ |
$5$ |
| $10-20$ |
$9$ |
$10-20$ |
$19$ |
| $20-30$ |
$17$ |
$20-30$ |
$15$ |
| $30-40$ |
$12$ |
$30-40$ |
$10$ |
| $40-50$ |
$9$ |
$40-50$ |
$1$ |
Represent the marks of the students of both the sections on the same graph by frequency polygons. View full solution →The length of $40$ leaves of a plant are measured correct to one millimetre, and the obtained data is represented in the following table :
| Length (in mm) |
Number of leaves |
| $118-126$ |
$3$ |
| $127-135$ |
$5$ |
| $136-144$ |
$9$ |
| $145-153$ |
$12$ |
| $154-162$ |
$5$ |
| $163-171$ |
$4$ |
| $172-180$ |
$2$ |
$i.$ Draw a histogram to represent the given data. $[$Hint: First make the class intervals continous$]$
$ii.$ Is there any other suitable graphical representation for the same data?
$iii.$ Is it correct to conclude that the maximum number of leaves are $153$ mm long$?$ Why$?$
View full solution →Draws a graphical representation of the points scored by team $B.$
His graphical representation is given below.
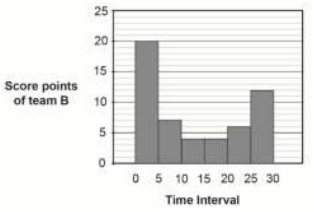
$10.$ Suman says, “Arun’s graphical representation is not appropriate.”
Do you agree with Suman? Mention $YES$ or $NO.$ Give reason to justify your choice. View full solution →In a school camp, $40$ students were divided into two groups to play a game.
The table given below shows the scores of team $A$ and team $B.$
| Time(s) in minutes |
Cumulative Score of Team $A$ |
Cumulative Score of Team $A$ |
| $0-5$ |
$14$ |
$20$ |
| $5-10$ |
$35$ |
$27$ |
| $10-15$ |
$30$ |
$31$ |
| $15-20$ |
$35$ |
$31$ |
| $20-25$ |
$44$ |
$37$ |
| $25-30$ |
$52$ |
$50$ |
$7.$ How many score points did team A get between $10-15$ minutes$?$
$A. 6$
$B. 24$
$C. 30$
$D. 68$
$8.$ Which team scored more points during last $5$ minutes$?$ Justify your answer.
$9.$ What is the mean number of score points obtained by team $A$ in a $5-$minute interval rounded to the nearest whole number$?$ View full solution →A charity surveys the people of a village for their haemoglobin counts. $25$ out of $100$ adult females in the village were tested. The result is given in this table.
| Haemoglobin (mg/dl) counts |
No. of females |
| $5$ |
$3$ |
| $6$ |
$3$ |
| $7$ |
$2$ |
| $8$ |
$5$ |
| $9$ |
$1$ |
| $10$ |
$1$ |
| $11$ |
$3$ |
| $12$ |
$4$ |
| $13$ |
$2$ |
| $14$ |
$1$ |
$4.$ A haemoglobin counts below 12 is considered deicient.
What proportion of females in the survey can be considered deicient$?$
$A. \frac{3}{25}$
$B. \frac{4}{25}$
$C. \frac{18}{25}$
$D. \frac{22}{25}$
$5.$ What is the median haemoglobin counts (mg/dl) of the females in the survey$?$
$A. 8$
$B. 9$
$C. 9.5$
$D. 12.5$
$6.$Divya said that $8$ and $12$ are the most observed haemoglobin counts (mg/dl) among $25$ females.
Krishna said that $8$ and $12$ are the most observed haemoglobin counts (mg/dl) among $100$ females in the village.
Who is correct? Explain your answer. View full solution →Five friends Anchal, Amisha, Mahi, Vaishu and Sahar are living in a hostel.
At the end of every month, they calculate the expenses on food and shopping.
The table given below shows their monthly expenses for the month of November.
| Name |
Anchal |
Amisha |
Mahi |
Vishu |
Sahar |
| Expenditure (in Rs) |
$3000$ |
$5000$ |
$6000$ |
$4500$ |
$7000$ |
$1.$ Which graphical representation method would best represent the data given$?$
$2.$ What is the average expense of the friends for the month of November$?$
$3.$ Anchal says, “The difference between the median expenditures for October and November amounts to $0\%$ of the November expense, and we have been able to reduce our median expense for November.”
What was their median expense for the month of October$?$
$A. 12π$
$B. 15π$
$C. 19π$
$D. 20π$ View full solution →Read the Source Text given below and answer these questions: In an effort to provide high$-$quality and safe playgrounds for kids, our reputable manufacturers adhere to the playground safety guidelines set forth by the Indian Consumer Product Safety Commission $(\text{CPSC})$ and the Indian Society for Advancement of Materials and Processing Engineering $(\text{ISAMPE}).$ These organizations set the guidelines for determining the types of playground equipment that is appropriate for kids within specific age groups: $2-3$ years, $3-5$ years, $5-7$ years, $7-10$ years, $10-15$ years, and $15-17$ years. A random survey of the number of children of various age groups playing in a park was found as follows:

|
Age (in years)
|
Number of children
|
|
$1-2$
|
$5$
|
|
$2-3$
|
$3$
|
|
$3-5$
|
$6$
|
|
$5-7$
|
$12$
|
|
$7-10$
|
$9$
|
|
$10-15$
|
$10$
|
|
$15-17$
|
$4$
|
The histogram is as given below: 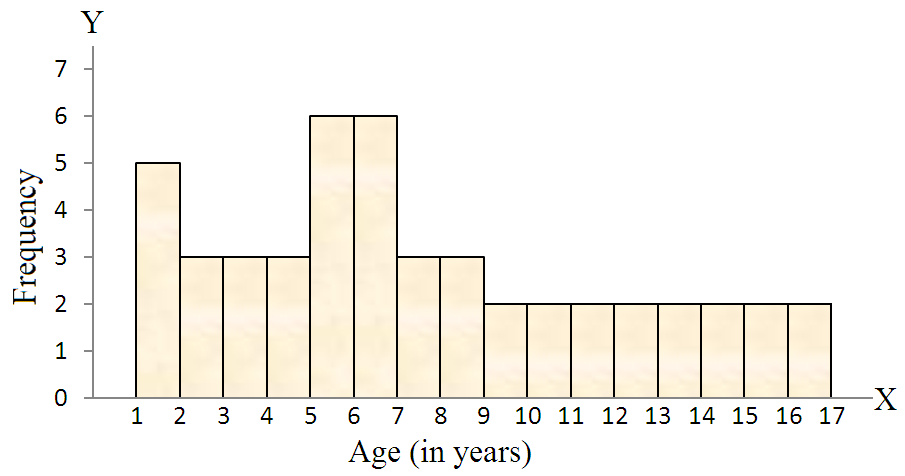
$i.$ In this question, the class sizes are different. So, calculate the adjusted frequency for each class by using the following formula:
Frequency density or adjusted frequency for class:
$a. \frac{\text{Minimum class size}}{\text{Class size of this class}}\times$ Its Frequency
$b. \frac{\text{Minimum class mark}}{\text{Class size of this class}}\times$ Its Frequency
$c. \frac{\text{Minimum Frequency}}{\text{Class size of this class}}\times$ Its class size
$d. \frac{\text{Minimum class mark}}{\text{Class mark of this class}}$
$ii.$ In this question the minimum class size is:
$a. 0$
$b. 1$
$c. 2$
$d. 3$
$iii.$ The class limits of third class interval $3-5:$
$a.$ Lower limit $= 5,$ upper limit $= 3$
$b.$ Lower limit $= 5,$ upper limit $= 7$
$c.$ Lower limit $= 3,$ upper limit $= 5$
$d. $Lower limit $= 7,$ upper limit $= 5$
$iv.$ Adjusted Frequency for class interval $5-7$ and $7-10:$
$a. 3, 6$
$b. 3, 3$
$c. 6, 6$
$d. 6, 3$
$v.$ Find the class mark of class $15 - 17:$
$a. 16$
$b. 12$
$c. 25$
$d. 2$ View full solution →