Questions

Case study (4 Marks)

Take a timed test

11 questions · self-marked practice — reveal the answer and mark yourself.

Question 14 Marks
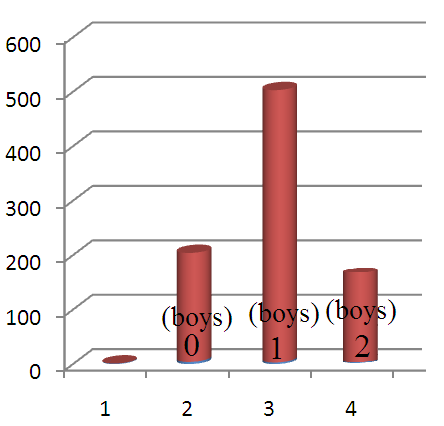
Draws a graphical representation of the points scored by team $B.$
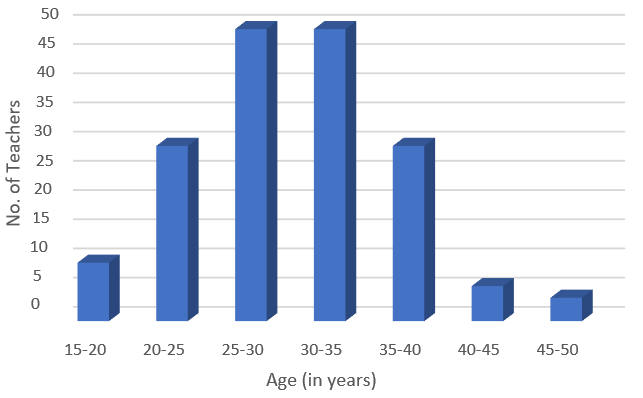
His graphical representation is given below.
Image
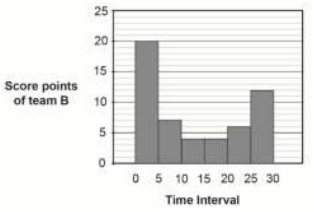
$10.$ Suman says, “Arun’s graphical representation is not appropriate.”
Do you agree with Suman? Mention $YES$ or $NO.$ Give reason to justify your choice.
Answer
$10.$ No, with at least one of the two aspects focussed
● Inappropriate scale for horizontal axis.
● Incorrect data representation for interval $15 – 20.$
No, The time scale is should be continuous
No, the data for the interval needs to be $0$
View full question & answer
Question 24 Marks
In a school camp, $40$ students were divided into two groups to play a game.
The table given below shows the scores of team $A$ and team $B.$
Time(s) in minutes Cumulative Score of Team $A$ Cumulative Score of Team $A$
$0-5$ $14$ $20$
$5-10$ $35$ $27$
$10-15$ $30$ $31$
$15-20$ $35$ $31$
$20-25$ $44$ $37$
$25-30$ $52$ $50$
$7.$ How many score points did team A get between $10-15$ minutes$?$
$A. 6$
$B. 24$
$C. 30$
$D. 68$
$8.$ Which team scored more points during last $5$ minutes$?$ Justify your answer.
$9.$ What is the mean number of score points obtained by team $A$ in a $5-$minute interval rounded to the nearest whole number$?$
Answer
$7. A. 6$
$8.$ Team $B$ with valid reasoning
● Team $B$ scored more than team $A$ as during the last $5$ minutes, the score of team $B$ is $13$ and the score of team $A$ is 8 in the last ive minutes.
$9. 9$
$9$ points
View full question & answer
Question 34 Marks
A charity surveys the people of a village for their haemoglobin counts. $25$ out of $100$ adult females in the village were tested. The result is given in this table.
Haemoglobin (mg/dl) counts No. of females
$5$ $3$
$6$ $3$
$7$ $2$
$8$ $5$
$9$ $1$
$10$ $1$
$11$ $3$
$12$ $4$
$13$ $2$
$14$ $1$
$4.$ A haemoglobin counts below 12 is considered deicient.
What proportion of females in the survey can be considered deicient$?$
$A. \frac{3}{25}$
$B. \frac{4}{25}$
$C. \frac{18}{25}$
$D. \frac{22}{25}$
$5.$ What is the median haemoglobin counts (mg/dl) of the females in the survey$?$
$A. 8$
$B. 9$
$C. 9.5$
$D. 12.5$
$6.$Divya said that $8$ and $12$ are the most observed haemoglobin counts (mg/dl) among $25$ females.
Krishna said that $8$ and $12$ are the most observed haemoglobin counts (mg/dl) among $100$ females in the village.
Who is correct? Explain your answer.
Answer
$4. C. \frac{18}{25}$
$5. B. 9$
$6.$ Divya with valid explanation
● Divya, since only $25$ females were tested.
View full question & answer
Question 44 Marks
Five friends Anchal, Amisha, Mahi, Vaishu and Sahar are living in a hostel.
At the end of every month, they calculate the expenses on food and shopping.
The table given below shows their monthly expenses for the month of November.
Name Anchal Amisha Mahi Vishu Sahar
Expenditure (in Rs) $3000$ $5000$ $6000$ $4500$ $7000$
$1.$ Which graphical representation method would best represent the data given$?$
$2.$ What is the average expense of the friends for the month of November$?$
$3.$ Anchal says, “The difference between the median expenditures for October and November amounts to $0\%$ of the November expense, and we have been able to reduce our median expense for November.”
What was their median expense for the month of October$?$
$A. 12π$
$B. 15π$
$C. 19π$
$D. 20π$
Answer
$1.$ Bar graph
$2. 5100$
$Rs. 5100$
$3. C. Rs. 5500$
View full question & answer
Question 54 Marks
Read the Source Text given below and answer these questions: In an effort to provide high$-$quality and safe playgrounds for kids, our reputable manufacturers adhere to the playground safety guidelines set forth by the Indian Consumer Product Safety Commission $(\text{CPSC})$ and the Indian Society for Advancement of Materials and Processing Engineering $(\text{ISAMPE}).$ These organizations set the guidelines for determining the types of playground equipment that is appropriate for kids within specific age groups: $2-3$ years, $3-5$ years, $5-7$ years, $7-10$ years, $10-15$ years, and $15-17$ years. A random survey of the number of children of various age groups playing in a park was found as follows:
 
Age (in years)
Number of children
$1-2$
$5$
$2-3$
$3$
$3-5$
$6$
$5-7$
$12$
$7-10$
$9$
$10-15$
$10$ 
$15-17$
$4$
The histogram is as given below:
$i.$ In this question, the class sizes are different. So, calculate the adjusted frequency for each class by using the following formula:

Frequency density or adjusted frequency for class:

$a. \frac{\text{Minimum class size}}{\text{Class size of this class}}\times$ Its Frequency
$b. \frac{\text{Minimum class mark}}{\text{Class size of this class}}\times$ Its Frequency
$c. \frac{\text{Minimum Frequency}}{\text{Class size of this class}}\times$ Its class size
$d. \frac{\text{Minimum class mark}}{\text{Class mark of this class}}$
$ii.$ In this question the minimum class size is:
$a. 0$
$b. 1$
$c. 2$
$d. 3$
$iii.$ The class limits of third class interval $3-5:$
$a.$ Lower limit $= 5,$ upper limit $= 3$
$b.$ Lower limit $= 5,$ upper limit $= 7$
$c.$ Lower limit $= 3,$ upper limit $= 5$
$d. $Lower limit $= 7,$ upper limit $= 5$
$iv.$ Adjusted Frequency for class interval $5-7$ and $7-10:$
$a. 3, 6$
$b. 3, 3$
$c. 6, 6$
$d. 6, 3$
$v.$ Find the class mark of class $15 - 17:$
$a. 16$
$b. 12$
$c. 25$
$d. 2$
Answer
$(i)$ $(a)$ $\frac{\text{Minimum class size}}{\text{Class size of this class}}\times$Its Frequency
$(ii)$ $(b)$ $1$
$(iii)$ $(c)$ Lower limit $= 3,$ upper limit $= 5$
$(iv)$ $(d)$ $6, 3$
$(v)$ $(a)$ $16$
View full question & answer
Question 64 Marks
Read the Source Text given below and answer answer these questions: A healthcare survey was done by the state health and family welfare care board of the state of Punjab. The data is collected by forming age groups; i.e; $10-15, 20-25 ....$ and so on. The overall data from a town is given below in the form of a bar graph. Read the data carefully and answer the questions that follow.

$i.$ What is the percentage of the youngest age-group persons over those in the oldest age group$?$
$a. 400.56\%$
$b. 466.67\%$
$c. 500\%$
$d. 500.67\%$
$ii.$ What is the total population of the town$?$
$a. 6800$
$b. 7000$
$c. 6700$
$d. 6600$
$iii.$ How many persons are more in the age-group $10-15$ than in the age group $30-35?$
$a. 100$
$b. 200$
$c. 250$
$d. 300$
$iv.$ What is the age-group of exactly $1200$ persons living in the town$?$
$a. 20-25$
$b. 10-15$
$c. 15-20$
$d. 25-30$
$v.$ What is the total number of persons living in the town in the age$-$groups $10-15$ and $60-65?$
$a. 2100$
$b. 2000$
$c. 2200$
$d. 2400$
Answer
$(i)$
$(b)$
$446.67\%$
$(ii)$
$(c)$
$6700$
$(iii)$
$(d)$
$300$
$(iv)$
$(a)$
$20-25$
$(v)$
$(c)$
$2200$
View full question & answer
Question 74 Marks
Read the Source Text given below and answer these questions:
A teacher is a person whose professional activity involves planning, organizing, and conducting group activities to develop students’ knowledge, skills, and attitudes as stipulated by educational programs. Teachers may work with students as a whole class, in small groups or one$-$to$-$one, inside or outside regular classrooms. In this indicator, teachers are compared by their average age and work experience measured in years.
For the same in $2015,$ the following distribution of ages $($in years$)$ of primary school teachers in a district was collected to evaluate the teacher on the above$-$mentioned criterion.

$i.$ Write the lower limit of the first$-$class interval:
$a. 15$
$b. 20$
$c. 17.5$
$d. 5$
$ii.$ Determine the class limits of the fourth class interval:
$a. 25-30$
$b. 30-35$
$c. 40-45$
$d. 45-50$
$iii.$ Find the class mark of class $45-50:$
$a. 45.5$
$b. 47.5$
$c. 54.5$
$d. 55.5$
$iv.$ Determine the class size:
$a. 4$
$b. 5.5$
$c. 5$
$d. 6$
$v. $Facts or figures collected with a definite purpose are called $..........$
$a.$ Data.
$b.$ Sample.
$c.$ Information.
$d.$ Statistics.
Answer
$(i)$ $(a)$ $15$
$(ii)$ $(b)$ $30-35$
$(iii)$ $(b)$ $47.5$
$(iv)$ $(c)$ $5$
$(v)$ $(a)$ Data.
View full question & answer
Question 84 Marks
Read the Source/ Text given below and answer these questions: The following data given the weight (in grams) of $30$ oranges picked from a basket$:\ 106, 107, 76, 109, 187, 95, 125, 92, 70, 139, 128, 100, 88, 84, 99, 113, 204, 141, 136, 123, 90, 115, 110, 97, 90, 107, 75, 80,$ Frequency distribution table:
Class Interval
Tally marks
Frequency
$60 - 80$
$|||$
$3$
$80 - 100$
 
$||||\ ||||$
$10$
$100 - 120$
$||||\ ||||$
$9$
$120 - 140$
$||||$
$5$
$140 - 160$
$|$
$1$
$160 - 180$
$-$
$0$
$180 - 200$
$|$
$1$
$200 - 220$
$|$
$1$
Total
$30$
$30$

$i. $Class Size of given class data:
$a. 20$
$b. 10$
$c. 30$
$d. 15$
$ii.$ Classmark of forth class:
$a.70$
$b.130$
$c.20$
$d.15$
$iii.$ The number of oranges, whose weight is more than $180g:$
$a.1$
$b.3$
$c.2$
$d.4$
$iv.$ The number of oranges, whose weight is less than $100g:$
$a.10$
$b.3$
$c.5$
$d.13$
$v.$ The range of data is:
$a.70$
$204$
$c.134$
$d.274$
Answer
$(i)$ $(a)$ $20$
$(ii)$ $(b)$ $130$
$(iii)$ $(c)$ $2$
$(iv)$ $(d)$ $13$
$(v)$ $(c)$ $134$
View full question & answer
Question 94 Marks
Read the Source/ Text given below and answer these questions:
In a healthcare survey by the state government of Maharashtra to study the malnutritional problems in children, $1000$ families with $2$ children were selected randomly from a town and the following data were recorded:


If a family is chosen at random.
$i.$ The probability that is no boy:
$a. -\frac{6}{25}$
$b. \frac{6}{25}$
$c. 0$
$d. \frac{3}{5}$
$ii.$ The probability that it has one boy:
$a.\frac{14}{25}$
$b.\frac{16}{25}$
$c.1$
$d. \frac{6}{25}$
$iii.$ The probability that it has $2$ boys:
$a.\frac35$
$b.\frac45$
$c.\frac15$
$d. \frac{3}{5}$
$iv.$ The probability that it has at least one boy:
$a.\frac{16}{25}$
$b.\frac{14}{25}$
$c.\frac{6}{25}$
$d. \frac{19}{25}$
$v.$ The probability that it has at most $1$ boy:
$a.\frac45$
$b.\frac65$
$c.\frac15$
$d. \frac15$
Answer
$(i)$ $(b)$ $\frac{6}{25}$
$(ii)$ $(a)$ $\frac{14}{25}$
$(iii)$ $(c)$ $\frac15$
$(iv)$ $(b)$ $\frac{14}{25}$
$(v)$ $(a)$ $\frac45$
View full question & answer
Question 104 Marks
Read the Source/ Text given below and answer any four questions:
A recent survey by a labour organization of the state government of Odisha found that the wages of workers in a factory for different age groups are distributed as given in the bar graph. Read the bar graph carefully and answer the questions that follow.


If a person is selected at random, find the probability that the person is.
$i. 40$ years or more:
$a. 0.675$
$b. 0.576$
$c. 0.86$
$d. 0.10$
$ii.$ Under $40$ years:
$a.0$
$b.0.325$
$c.0.531$
$d.0.27$
$iii.$ Having age from $30$ to $39$ years:
$a.0.553$
$b.0.513$
$c.0.135$
$d.0.125$
$iv.$ Under $60$ but above $39$ years:
$a.0.62$
$b.0.66$
$c.0.55$
$d.0.02$
$v.$ Not less than $20$ years:
$a.0$
$b.1.03$
$c.0.01$
$d.1$
Answer
$(i)$ $(a)$ $0.675$
$(ii)$ $(b)$ $0.325$
$(iii)$ $(c)$ $0.135$
$(iv)$ $(b)$ $0.66$
$(v)$ $(d)$ $1$
View full question & answer
Question 114 Marks
Read the Source/ Text given below and answer any four questions: The weights of newborn babies $($in $kg.)$ are recorded to maintain the health report cards in Apollo hospital on regular basis. On a particular day the weights of newborn recorded are are as follows$: \ 3.1, 3.0, 2.9, 2.9, 2.8, 2.8, 2.7, 2.7, 2.6, 2.5, 2.5, 2.4, 2.3, 2.2, 2.1.$

$i.$ Determine the range:
$a. 1.0\ Kg$
$b. 2.1\ Kg$
$c. 2.7\ Kg$
$d. 2.0\ kg$
$ii.$ How many babies were born on that day$?$
$a.11$
$b.15$
$c.12$
$d.16$
$iii.$ How many babies weight below $2.5\ kg?$
$a.3$
$b.4$
$c.5$
$d.6$
$iv.$ How many babies weigh more than $2.8\ kg?$
$a.1$
$b.2$
$c.3$
$d.4$
$v.$ How many babies weight $2.8\ kg?$
$a.1$
$b.2$
$c.3$
$d.4$
Answer
$(i)$ $(a)$ $1.0\ Kg$
$(ii)$ $(b)$ $15$
$(iii)$ $(c)$ $5$
$(iv)$ $(d)$ $4$
$(v)$ $(b)$ $2$
View full question & answer