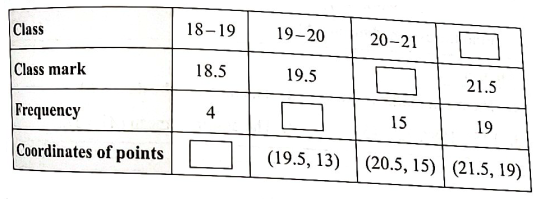
Complete the following activity to prepare a table of coordinates of points to draw a frequency polygon :
7 questions across 5 question groups — pick any mix to generate a Maths paper with step-by-step answer keys.
Complete the following activities and rewrite it : (2M)
2 Q→022 Marks Questions
1 Q→03Complete the following activities and rewrite it ( 3 marks)
1 Q→043 Marks Question
2 Q→054 Marks Questions
1 Q→One sample from each question group in this chapter. Select any group above to see the full set with answer keys.
| Class Time (In hours) | Class Marks $(x_i)$ | No. of Students $(f_i)$ | $f_i x_i$ |
| 0 - 2 | 1 | 8 | 08 |
| 2 - 4 | 3 | 14 | 42 |
| 4 - 6 | 5 | 18 | 90 |
| 6 - 8 | 7 | 10 | 70 |
| 8 - 10 | 9 | 10 | 90 |
| Price in Rupees | No. of Articles |
| Less than 20 | 140 |
| 20 - 40 | 100 |
| 40 - 60 | 80 |
| 60 - 80 | 60 |
| 80 - 100 | 20 |
| Marks | No. of Students |
| 0 - 10 | 25 |
| 10 - 20 | $x$ |
| 20 - 30 | 30 |
| 30 - 40 | $2x$ |
| 40 - 50 | 65 |
Pick question groups from the list above, set marks and difficulty, and export a branded PDF with step-by-step answer keys. First 3 chapters free — no signup.