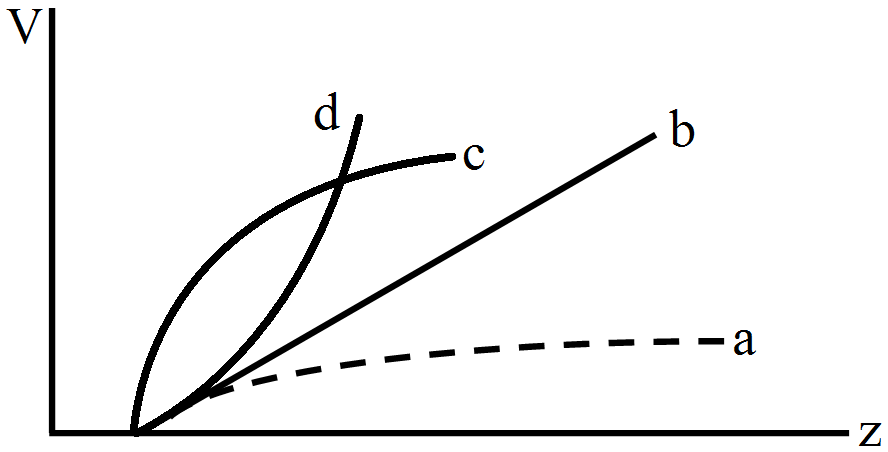
Frequencies of $\text{K}_\alpha \ X-$rays of different materials are measured. Which one of the graphs in the figure may represent the relation between the frequency $v$ and the atomic number $Z$?
View full solution →58 questions across 6 question groups — pick any mix to generate a Physics paper with step-by-step answer keys.
M.C.Q (1 Marks)
21 Q→021 Marks Question
3 Q→032 Marks Questions
9 Q→043 Marks Question
11 Q→054 Marks Questions
1 Q→065 Marks Questions
13 Q→One sample from each question group in this chapter. Select any group above to see the full set with answer keys.
|
Cell containing vacancy
|
K
|
L
|
M
|
|
Energy in keV
|
69.5
|
11.3
|
2.3
|
Pick question groups from the list above, set marks and difficulty, and export a branded PDF with step-by-step answer keys. First 3 chapters free — no signup.