Sample QuestionsData Handling questions
One sample from each question group in this chapter. Select any group above to see the full set with answer keys.
The marks (out of $10$) obtained by $28$ students in a Mathematics test are listed as below: $8, 1, 2, 6, 5, 5, 5, 0, 1, 9, 7, 8, 0, 5, 8, 3, 0, 8, 10, 10, 3, 4, 8, 7, 8, 9, 2, 0$ The number of students who obtained marks more than or equal to $5$, is:
Answer: D.
View full solution →Using tally marks, which one of the following represents the number eight:
Answer: D.
View full solution →In question $2$ above, the number of students who scored marks less than $4$ is:
Answer: D.
View full solution →The choices of the fruits of $42$ students in a class are as follows: $A, O, B, M, A, G, B, G, A, G, B, M, A, G, M, A, B, G, M, B, A, O, M, O, G, B, O, M, G, A, A, B, M, O, M, G, B, A, M, O, M, O,$ where $A, B, G, M$ and $O$ stand for the fruits Apple, Banana, Grapes, Mango and Orange respectively. Which two fruits are liked by an equal number of students?
- A
$A$ and $M$
- B
$M$ and $B$
- C
$B$ and $O$
- ✓
$B$ and $G$
Answer: D.
View full solution →According to data of question $4$, which fruit is liked by most of the students?
Answer: C.
View full solution →An observation occurring seven times in a data is represented as ________ using tally marks.
In a bar graph, each bar (rectangle) represents only one value of the numerical data.
In a bar graph, bars of uniform width are drawn vertically only.
In a pictograph, if a symbol

represents $50$ books in a library shelf, then the symbol

represents $25$ books. View full solution →On the scale of $1$ unit length $= 10$ crore, the bar of length $6$ units will represent crore and of units will represent $75$ crore.
View full solution →Students of Class $VI$ in a school were given a task to count the number of articles made of different materials in the school. The information collected by them is represented as follows:
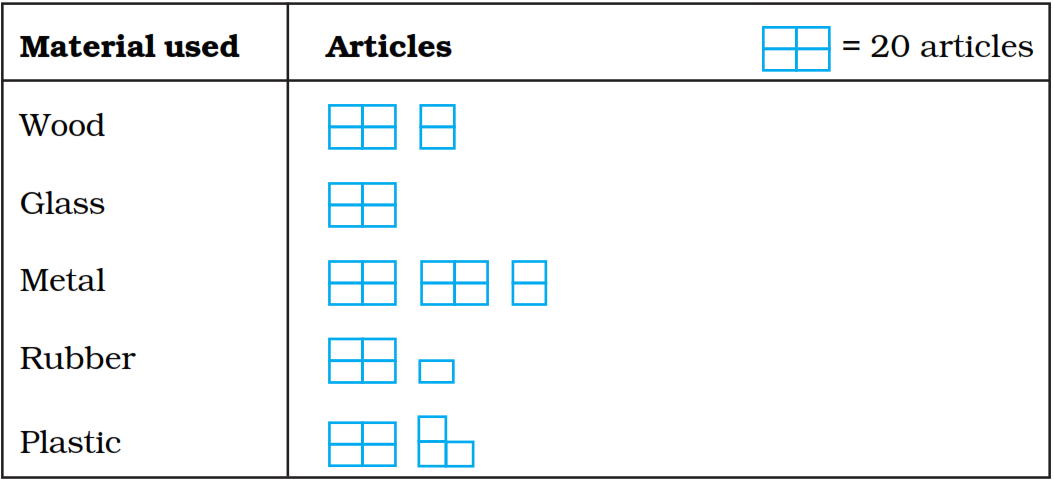
Observe the pictograph and answer the following questions:
$a.\ $Which material is used in maximum number of articles?
$b.\ $Which material is used in minimum number of articles?
$c.\ $Which material is used in exactly half the number of articles as those made up of metal?
$d.\ $What is the total number of articles counted by the students? View full solution →Following pictograph represents some surnames of people listed in the telephone directory of a city: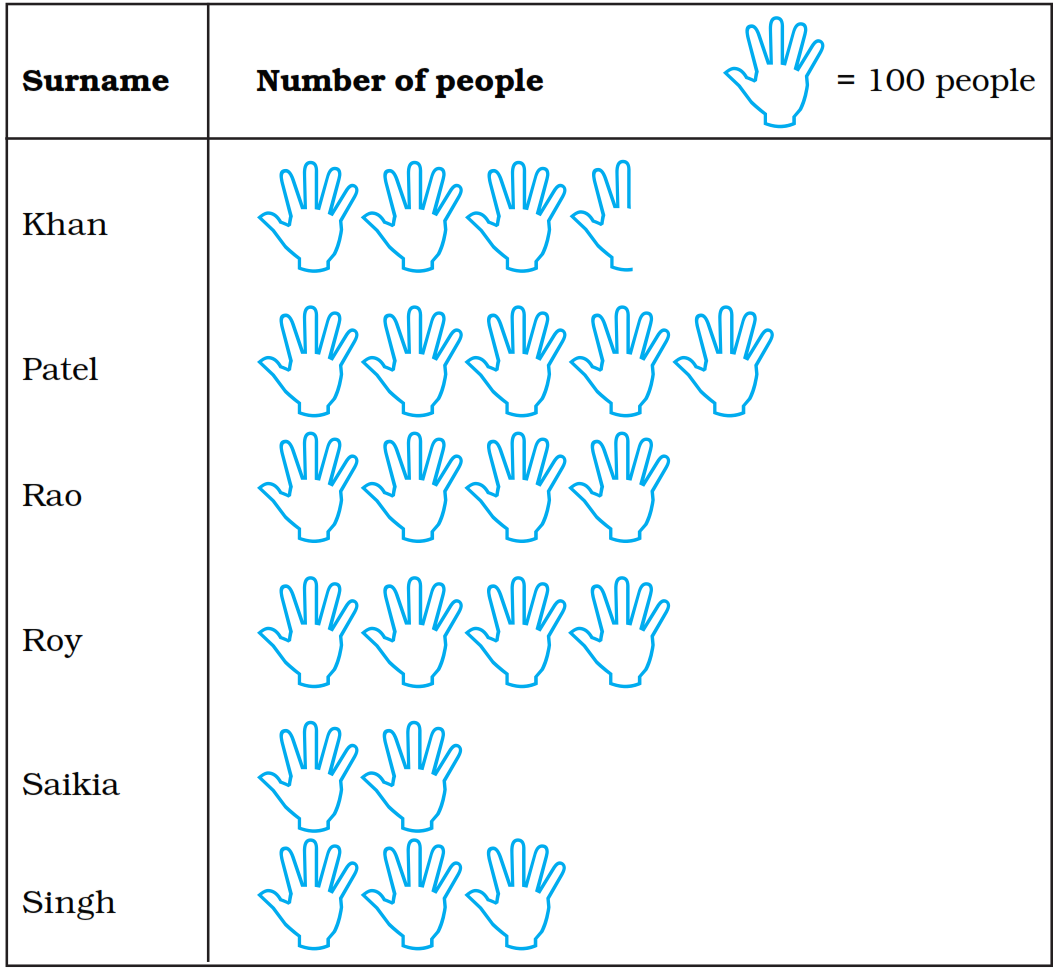
Observe the pictograph and answer the following questions:
$a.\ $How many people have surname ‘Roy’?
$b.\ $Which surname appears the maximum number of times in the telephone directory?
$c.\ $Which surname appears the least number of times in the directory?
$d.\ $Which two surnames appear an equal number of times? View full solution →In an examination, the grades achieved by $30$ students of a class are given below. Arrange these grades in a table using tally marks: $B, C, C, E, A, C, B, B, D, D, D, D, B, C, C, C, A, C, B, E, A, D, C, B, E, C, B, E, C, D$
View full solution →The following bar graph shows the number of houses $($out of $100)$ in a town using different types of fuels for cooking. Read the bar graph and answer the following questions: Scale: $1$ unit length $= 5$ houses
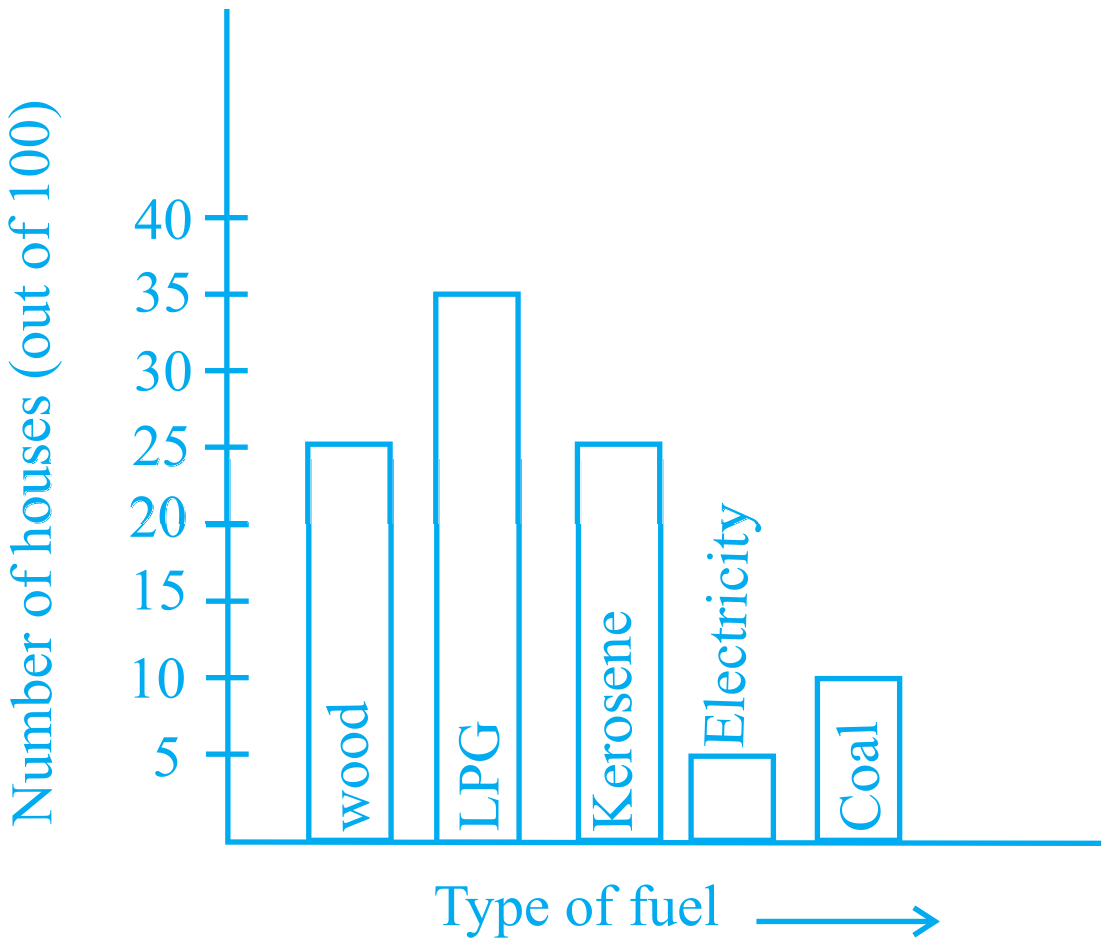
$a.\ $ Which fuel is used in maximum number of houses?
$b.\ $How many houses are using coal as fuel?
$c.\ $Suppose that the total number of houses in the town is $1$ lakh. From the above graph estimate the number of houses using electricity. View full solution →The lengths in centimetres (to the nearest centimetre) of 30 carrots are given as follows: $15, 22, 21, 20, 22,15, 15, 20, 20,15, 20, 18, 20, 22, 21, 20, 21, 18, 21, 18, 20, 18, 21, 18, 22, 20, 15, 21, 18, 20$ Arrange the data given above in a table using tally marks and answer the following questions.
$a.\ $What is the number of carrots which have length more than $20\ cm$?
$b.\ $Which length of the carrots occur maximum number of times? Minimum number of times?
View full solution →Refer to question $54.$ Prepare a bar graph of the data.
View full solution →Number of mobile phone users in various age groups in a city is listed below:
| Age group (in years) |
Number of mobile users |
| $1-20$ |
$25000$ |
| $21-40$ |
$40000$ |
| $41-50$ |
$35000$ |
| $61-80$ |
$10000$ |
Draw a bar graph to represent the above information. View full solution →The following table gives information about the circulation of newspapers (dailies) in a town in five languages.
| Language: |
English |
Hindi |
Tamil |
Punjabi |
Gujarati |
| Number of newspapers: |
$5000$ |
$8500$ |
$500$ |
$2500$ |
$1000$ |
Prepare a pictograph of the above data, using a symbol of your choice, each representing $1000$ newspapers. View full solution →The lengths in km (rounded to nearest hundred) of some major rivers of India is given below:
| River |
Length (in km) |
| Narmada |
$1300$ |
| Mahanadi |
$900$ |
| Brahmputra |
$2900$ |
| Ganga |
$2500$ |
| Kaveri |
$800$ |
| Krishna |
$1300$ |
Draw a bar graph to represent the above information. View full solution →In a botanical garden, the number of different types of plants are found as follows:
| Type of the plant |
Number of home appliances |
| Herb |
$50$ |
| Shrub |
$60$ |
| Creeper |
$20$ |
| Climber |
$45$ |
| Tree |
$95$ |
Draw a bar graph to represent the above information and answer the following questions:
$a.\ $Which type of plant is maximum in number in the garden?
$b.\ $Which type of plant is minimum in number in the garden? View full solution →