Question 15 Marks
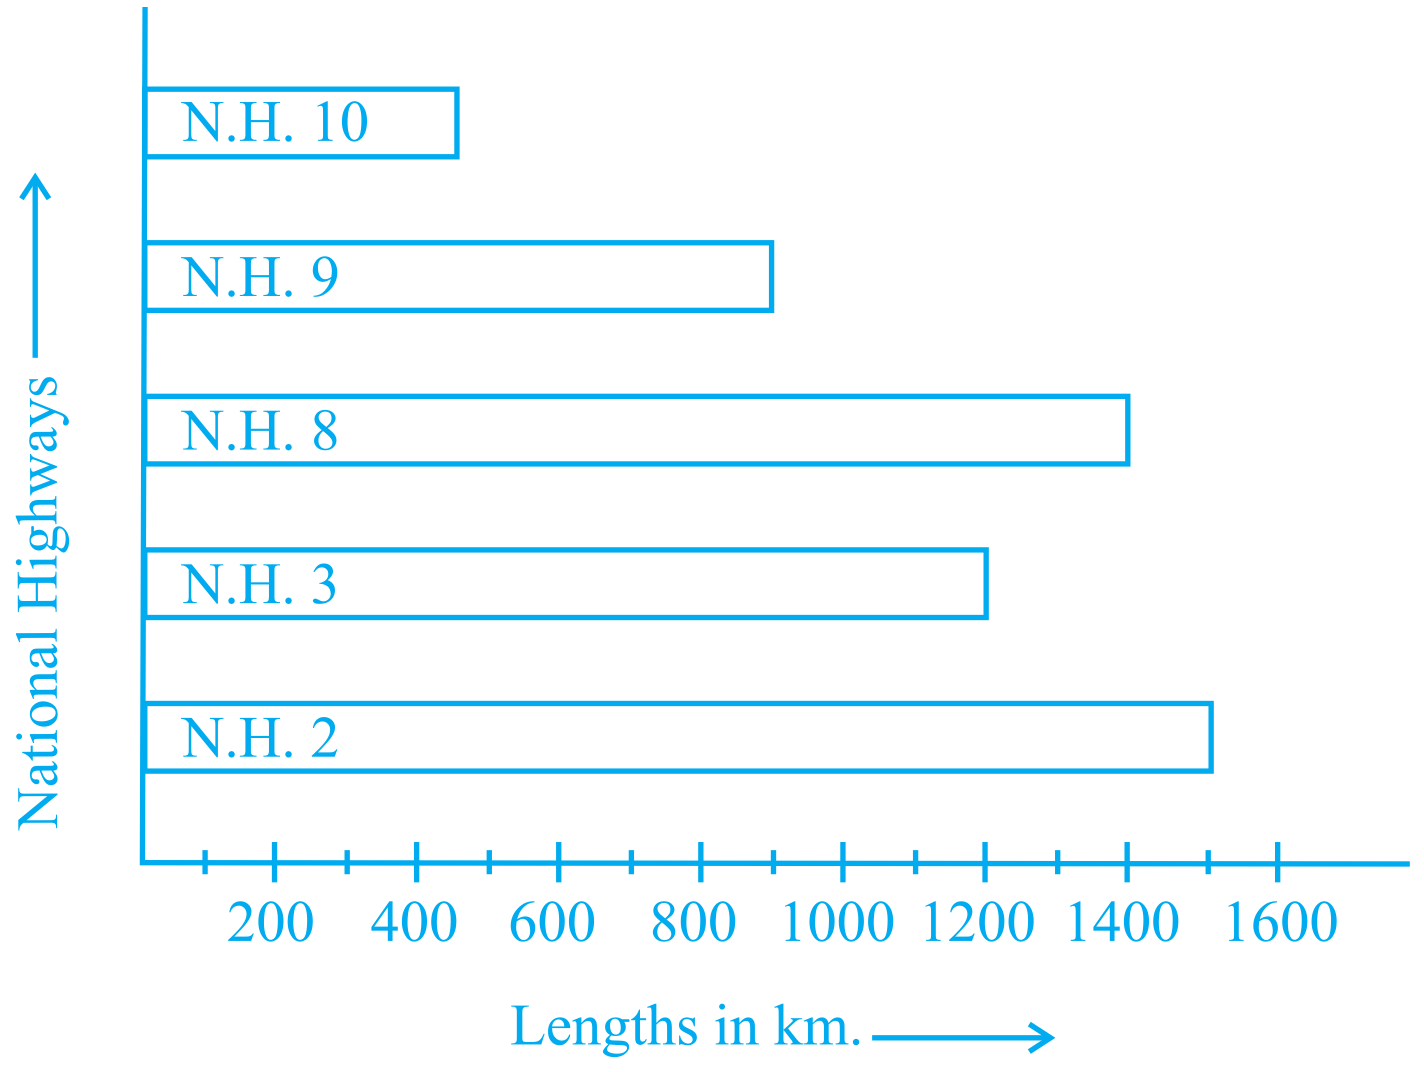
Refer to question $54.$ Prepare a bar graph of the data.
Answer
View full question & answer→In order to construct a bar graph representing above data, we follow the following steps:
Step I: Take a graph paper and draw two mutually perpendicular lines $OX$ and $OY.$ Let $OX$ as the horizontal axis and $OY$ as the vertical axis.
Step II: Along $OX,$ mark crop and along $OY,$ mark area of the land.
Step III: Along $OX,$ choose the uniform (equal) width of the bars and the uniform gap between them, according to the space available for the graph.
Step IV: Choose a suitable scale to determine the heights of the bars, according to the availability of space. Flere, we choose $1$ unit length to represents $5$ million hectares.
Step V: Calculate the heights of various bars as follows:
Hence, the required bar graph of the given data is shown below: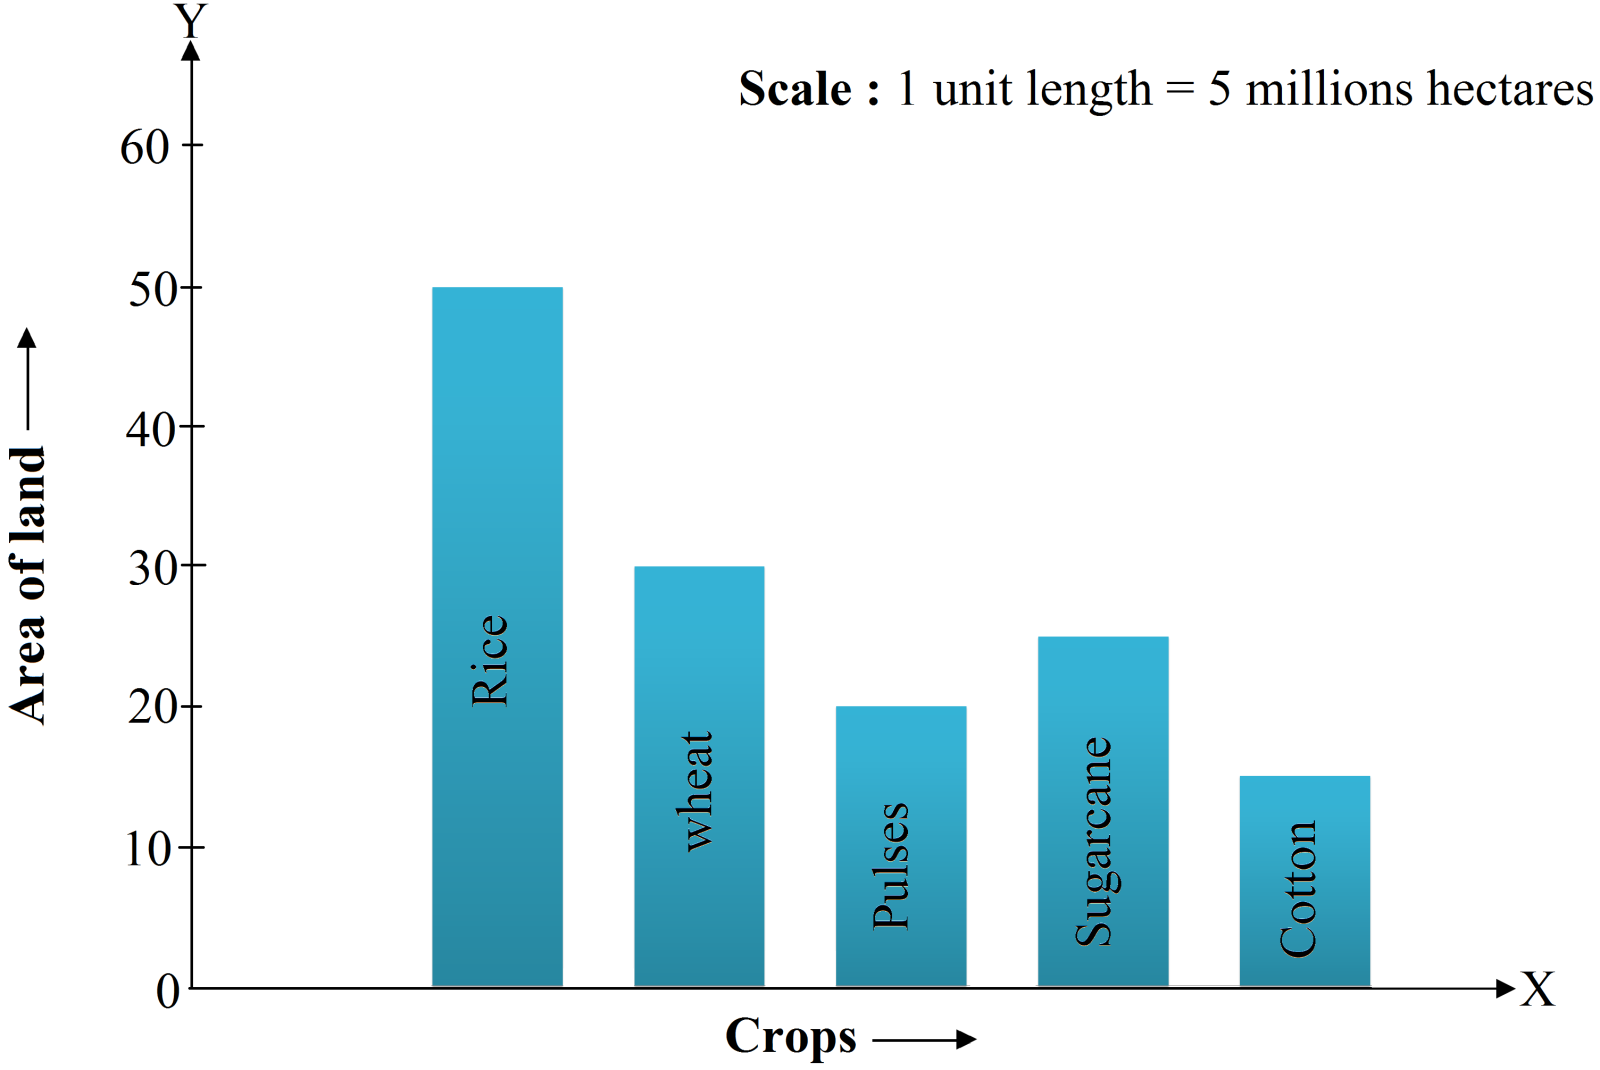
Step I: Take a graph paper and draw two mutually perpendicular lines $OX$ and $OY.$ Let $OX$ as the horizontal axis and $OY$ as the vertical axis.
Step II: Along $OX,$ mark crop and along $OY,$ mark area of the land.
Step III: Along $OX,$ choose the uniform (equal) width of the bars and the uniform gap between them, according to the space available for the graph.
Step IV: Choose a suitable scale to determine the heights of the bars, according to the availability of space. Flere, we choose $1$ unit length to represents $5$ million hectares.
Step V: Calculate the heights of various bars as follows:
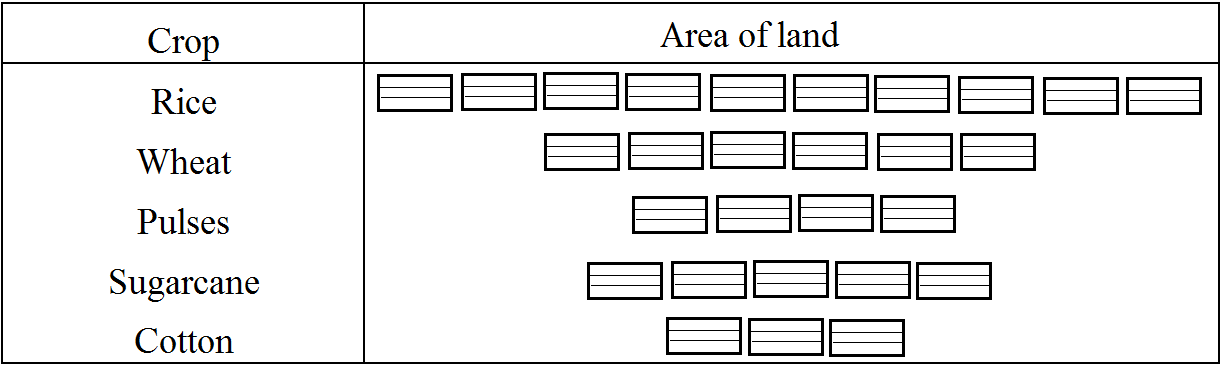
| Crop | Height of bars |
| Rice | $\frac{50}{5}=10\text{ units}$ |
| Wheat | $\frac{30}{5}=6\text{ units}$ |
| Pulses | $\frac{20}{5}=4\text{ units}$ |
| Sugarcane | $\frac{25}{5}=5\text{ units}$ |
| Cotton | $\frac{15}{2}=3\text{ units}$ |