Questions · Page 1 of 4

M.C.Q. [1 Marks Each]

Take a timed test

50 questions · auto-graded multiple-choice test.

MCQ 11 Mark
Refer, the given graph and answer the following question: How many total push-ups were done throughout the week?
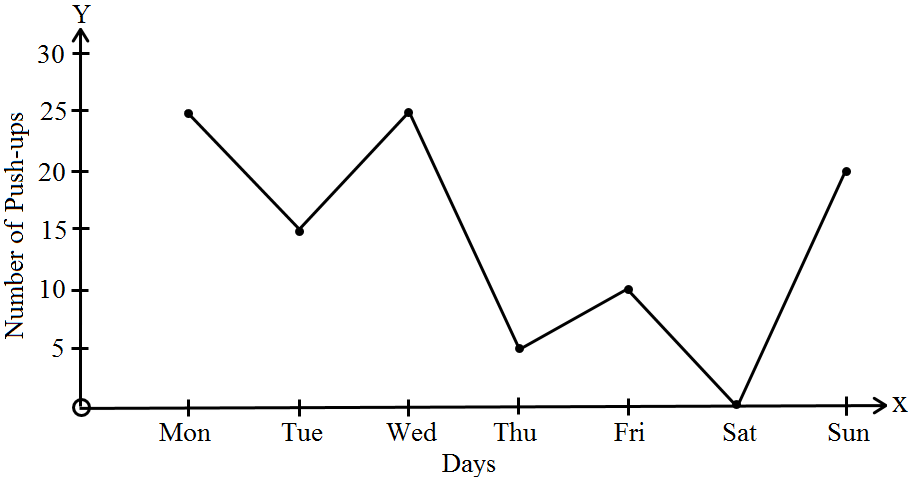
  • A
    $90$
  • B
    $110$
  • $100$
  • D
    $105$
Answer
Correct option: C.
$100$
Summing up the push-ups for each day $= 25 + 15 + 25 + 5 + 10 + 0 + 20 = 100$
So, the total number of push-ups done throughout the week is $100.$
View full question & answer
MCQ 21 Mark
Read the graph and answer the related questions:

In which year was the rate of interest maximum?
  • $2005$
  • B
    $2003$
  • C
    $2006$
  • D
    $2002$
Answer
Correct option: A.
$2005$

$2005 \rightarrow 12$

View full question & answer
MCQ 31 Mark
Read the circle graph and answer the related questions:

The sum of the number of students of class $III$ and class $IV$ is.
  • A
    $500$
  • B
    $1000$
  • C
    $50$
  • $250$
Answer
Correct option: D.
$250$

$125 + 125 = 250$

View full question & answer
MCQ 41 Mark
Observe the following runs-over graph and answer the related questions:

In which over are the minimum runs scored?
  • A
    $X$
  • B
    $XI$
  • $XII$
  • D
    $IX$
Answer
Correct option: C.
$XII$

$XII \rightarrow 1$

View full question & answer
MCQ 61 Mark
If the imports of the company in $1996$ was Rs. $272$ crores, the exports from the company in $1996$ was?
  • A
    Rs. $370$ crores
  • Rs. $320$ crores
  • C
    Rs. $280$ crores
  • D
    Rs. $275$ crores
Answer
Correct option: B.
Rs. $320$ crores
Ratio of imports to exports in the year $1996 = 0.85.$
Let the exports in $1996 =$ Rs. x crores.
Then, $\frac{272}{\text{x}}​=0.85$
$\Rightarrow\text{x}=\frac{272}{0.85}=320$
$\therefore$ Exports in $1996 =$ Rs. $320$ crores.
View full question & answer
MCQ 71 Mark
$..........$ is a type of bar diagram, where the class intervals are shown on the hirizontal axis.
  • Histogram
  • B
    Bar chart
  • C
    Line graph
  • D
    Pie chart
Answer
Correct option: A.
Histogram
Histogram is a type of bar diagram, where the class intervals are shown on the horizontal axis.
View full question & answer
MCQ 81 Mark
Observe the following runs-over graph and answer the related questions: 

What is the difference of runs scored in $IV$ and $V$ overs?
  • $1$
  • B
    $2$
  • C
    $3$
  • D
    $4$
Answer
Correct option: A.
$1$
$8 - 7 = 1$
View full question & answer
MCQ 91 Mark
Observe the following histogram and answer the related questions:

In which class intervals, is the number of students $200?$
  • $5-10$
  • B
    $0-5$
  • C
    $20-25$
  • D
    $15-20$
Answer
Correct option: A.
$5-10$
$5-10 \rightarrow 200$
View full question & answer
MCQ 101 Mark
Read the circle graph and answer the related questions:

There are in all $1000$ students in a school. The number of students of class $I$ are.
  • $500$
  • B
    $250$
  • C
    $125$
  • D
    None of these
Answer
Correct option: A.
$500$
$\frac{50}{100}\times=500$
View full question & answer
MCQ 111 Mark
How many sets had more even than negative numbers?
  • A
    $0$
  • B
    $1$
  • $2$
  • D
    $3$
Answer
Correct option: C.
$2$

Set $A$ and Set $C$ have more even numbers.

View full question & answer
MCQ 121 Mark
The line graph shows the number of students in each department of a school. What does the second number in the ordered pair $(9, 10)$ represent?
  • A
    Number of department
  • B
    Line graph
  • Number of students
  • D
    School department
Answer
Correct option: C.
Number of students
The second number in the ordered pair $(9, 10)$ represent $10$ number of students in the department $9.$
View full question & answer
MCQ 131 Mark
The following line graph shows the yearly sales figures for a manufacturing company. What were the sales (in Rs. crores) in $2002$?
  • A
    $2$
  • $4$
  • C
    $6$
  • D
    $8$
Answer
Correct option: B.
$4$

As shown in the above graph, $y$ axis represents the sales(in crores) and $x$ axis represents the years.
So in the year $2002$ the sales were upto $4$ crore.

View full question & answer
MCQ 141 Mark
Find the time taken by a body to cover $25$ metres.
  • A
    $4$ seconds
  • B
    $6$ seconds
  • C
    $3$ seconds
  • $5$ seconds
Answer
Correct option: D.
$5$ seconds
$5$ seconds
View full question & answer
MCQ 151 Mark
Read the circle graph and answer the related questions:

The minimum number of students in any class is:
  • $125$
  • B
    $250$
  • C
    $500$
  • D
    $1000$
Answer
Correct option: A.
$125$

$\frac{25}{2}\times\frac{1000}{100}=125$

View full question & answer
MCQ 161 Mark
Find the distance covered in $7$ seconds.
  • A
    $30\ m$
  • B
    $25\ m$
  • $35\ m$
  • D
    $20\ m$
Answer
Correct option: C.
$35\ m$
$35\ m$
View full question & answer
MCQ 171 Mark
With the help of which of the following will you describe the position of a pen on a table?
  • Coordinate geometry
  • B
    Algebra
  • C
    Trignometry
  • D
    Proportions
Answer
Correct option: A.
Coordinate geometry
Coordinate geometry is used to describe the position of an object lying in a plane.
View full question & answer
MCQ 181 Mark
Find the distance covered in $4$ seconds.
  • $20\ m$
  • B
    $15\ m$
  • C
    $5\ m$
  • D
    $10\ m$
Answer
Correct option: A.
$20\ m$
$20\ m$
View full question & answer
MCQ 191 Mark
Observe the following runs-over graph and answer the related questions:

In which year was the rate of interest minimum?
  • $2006$
  • B
    $2004$
  • C
    $2001$
  • D
    $2005$
Answer
Correct option: A.
$2006$
$2006 \rightarrow 4$
View full question & answer
MCQ 201 Mark
In a bar chart, the $..........$ are represented by the heights of the bars.
  • A
    variables
  • B
    weights
  • frequencies
  • D
    constant
Answer
Correct option: C.
frequencies
In a bar chart, the frequencies are represented by the heights of the bars.
View full question & answer
MCQ 211 Mark
The point $(3, 2)$ is nearer to:
  • $X-$axis
  • B
    $Y-$oxis
  • C
    Origin
  • D
    None of these.
Answer
Correct option: A.
$X-$axis


The point $(3, 2)$ is nearer to $x-$ axis.
View full question & answer
MCQ 221 Mark
Observe the following bar graph and answer the related questions:

On which head, is the expenditure maximum?
  • A
    Travelling allowance.
  • B
    Rent.
  • C
    Appliances.
  • Salary of employees.
Answer
Correct option: D.
Salary of employees.
The length of the bar corresponding to the head ‘salary of employees’ is maximum.
View full question & answer
MCQ 231 Mark
The point $(0, 4)$ lies on which of the following:
  • A
    $X-$axis
  • $Y-$axis
  • C
    Origin
  • D
    None of these.
Answer
Correct option: B.
$Y-$axis

Point $(0, 4)$ lies on $y$ -axis, because its of the form $(0, y)$ where $x = 0.$

View full question & answer
MCQ 241 Mark
Read the circle graph and answer the related questions.

The number of students of class II is:
  • A
    $500$
  • $250$
  • C
    $125$
  • D
    $100$
Answer
Correct option: B.
$250$

$\frac{25}{100}\times1000=250$

View full question & answer
MCQ 251 Mark
A line graph which is a whole unbroken line is called a:
  • Linear graph
  • B
    Pie$-$chart
  • C
    Histograph
  • D
    Bar$-$graph
Answer
Correct option: A.
Linear graph
Linear graph
View full question & answer
MCQ 261 Mark
Observe the following temperature time graph and answer the related questions:

What are the coordinates of a point whose $x-$coordinate is $1$ and $y-$coordinate isO?
  • $(1, 0)$
  • B
    $(0, 0)$
  • C
    $(0, 1)$
  • D
    $(1, 1)$
Answer
Correct option: A.
$(1, 0)$
$(1, 0)$
View full question & answer
MCQ 271 Mark
The frequency curve shows the number of students ages $11$ through $17$ in Chennai city that have mobile phones. Refer to the frequency curve below to answer each question. How many mobile phones do $13$ year-old have?
  • A
    $10$
  • $15$
  • C
    $20$
  • D
    $25$
Answer
Correct option: B.
$15$
$13$ year-old have $15$ mobile phones as shown in the graph.
View full question & answer
MCQ 281 Mark
Name the graph which is used to represent data in discrete manner?
  • A
    pie
  • B
    histogram
  • bar
  • D
    frequency polygon
Answer
Correct option: C.
bar
The bar graph is used to represent data in a discrete manner. An example is shown above.
View full question & answer
MCQ 291 Mark
Below is the data of the number of men and women in a village for different years. Now based on this data answer the following $MCQ$s with the correct option.

When is the population of men, the minimum?
  • A
    $2010$
  • B
    $2015$
  • C
    $2020$
  • $2005$
Answer
Correct option: D.
$2005$
In $2005$, there were only $500$ men in the village.
View full question & answer
MCQ 301 Mark
Observe the following temperature time graph and answer the related questions:

The coordinates of the origin are.
  • $(0, 0)$
  • B
    $(1, 0)$
  • C
    $(0, 1)$
  • D
    $(1, 1)$
Answer
Correct option: A.
$(0, 0)$
$(0, 0)$
View full question & answer
MCQ 311 Mark
The point $(-2, -2)$ is:
  • Equidistant from $x-$axis and $y-$axis.
  • B
    Near to $x-$axis.
  • C
    Near to $y-$axis.
  • D
    Near to origin.
Answer
Correct option: A.
Equidistant from $x-$axis and $y-$axis.
View full question & answer
MCQ 321 Mark
A $..........$ is a bar graph that shows data in intervals.
  • A
    Bar$-$graph
  • B
    Pie$-$chart
  • Histograph
  • D
    Line Graph
Answer
Correct option: C.
Histograph
Histograph
View full question & answer
MCQ 331 Mark
The point $(4, 0)$ lies on which of the following?
  • $X-$axis
  • B
    $Y-$axis
  • C
    Origin
  • D
    None of the above.
Answer
Correct option: A.
$X-$axis
$X-$axis
View full question & answer
MCQ 341 Mark
$(O, Y)$ are the co-ordinates of a point lying on which of the following?
  • A
    Origin
  • $X-$axis
  • C
    $Y-$axis
  • D
    None of these.
Answer
Correct option: B.
$X-$axis

$(0, y)$ are the co-ordinates of a point lying on $y$ axis because points on $y-$axis have $x-$coordinate $0.$

View full question & answer
MCQ 351 Mark
Read the graph and answer the related questions:

Find the rise in the number of labourers from $2001$ to $2004.$
  • A
    $200$
  • B
    $300$
  • $400$
  • D
    $500$
Answer
Correct option: C.
$400$
$2001 \rightarrow 200$
$2004 \rightarrow 600$
$600 - 200 = 400$
View full question & answer
MCQ 361 Mark
Which of the following point will lie on $y-$axis'?
  • A
    $(8, 9)$
  • $(0, 6)$
  • C
    $(6, 0)$
  • D
    $(-4, -5)$
Answer
Correct option: B.
$(0, 6)$

In $(0, 6)$, the $x-$coordinate is zero and $y-$coordinate is $6$. So $(0, 6)$ will lie on $y-$axis.

View full question & answer
MCQ 371 Mark
Observe the following circle-graph and answer the related questions:

What is the sum of the expenditures on food and education if the budget of the family is Rs. $10800?$
  • A
    Rs. $5000$
  • B
    Rs. $8000$
  • Rs. $5400$
  • D
    Rs. $6000$
Answer
Correct option: C.
Rs. $5400$
$150+30=180$
$\frac{180}{360}\times10800=5400$
View full question & answer
MCQ 381 Mark
Rectangle bars touching each other in which graph $...........$
  • histogram
  • B
    bar
  • C
    pie
  • D
    line
Answer
Correct option: A.
histogram
Rectangle bars touching each other in histogram graph,
View full question & answer
MCQ 391 Mark
Find the coordinates of the point $D$ from the graph.
  • A
    $(0, -4)$
  • B
    $(-4, 5)$
  • $(3, 1)$
  • D
    None of these.
Answer
Correct option: C.
$(3, 1)$
$(3, 1)$
View full question & answer
MCQ 401 Mark
Find the time taken by a body to cover $30$ metres.
  • $6$ seconds
  • B
    $5$ seconds
  • C
    $4$ seconds
  • D
    $3$ seconds
Answer
Correct option: A.
$6$ seconds
$6$ seconds
View full question & answer
MCQ 411 Mark
Observe the following temperature time graph and answer the related questions:

What are the coordinates of a point whose x-coordinate is $3$ and $y-$coordinate is $4?$
  • A
    $(3, 3)$
  • $(3, 4)$
  • C
    $(4, 3)$
  • D
    $(4, 3)$
Answer
Correct option: B.
$(3, 4)$
$(3, 4)$
View full question & answer
MCQ 421 Mark
The point $(3, 4)$ is at a distance of:
  • A
    $3$ from both the axis.
  • B
    $4$ from both the axis.
  • $4$ from the $x$ axis and $3$ from $y$ axis.
  • D
    $3$ from $x$ axis and from $y$ axis.
Answer
Correct option: C.
$4$ from the $x$ axis and $3$ from $y$ axis.
We know that, the $x-$coordinate is the distance of the point from $Y-$axis and that of $y-$coordinate is the distance from $X-$axis.
Hence, the point $(3, 4)$ is at a distance of $4$ from the $X-$axis and $3$ from $Y-$axis.
View full question & answer
MCQ 431 Mark
A graph that displays data that changes continuously over periods of time is called:
  • A
    Bar-graph
  • B
    Pie-chart
  • C
    Histograph
  • Line Graph
Answer
Correct option: D.
Line Graph
Line Graph
View full question & answer
MCQ 441 Mark
Which of the points given is a point on the $X-$axis?
  • $(5, 0)$
  • B
    $(0, 5)$
  • C
    $(5, 3)$
  • D
    $(3, 5)$
Answer
Correct option: A.
$(5, 0)$
$(5, 0)$
View full question & answer
MCQ 451 Mark
$..........$ represents data that changes continuously over period of time.
  • Line graph
  • B
    Pie graph
  • C
    Bar graph
  • D
    Histogram
Answer
Correct option: A.
Line graph
The line graphs shows a change in data over time. A line graph is useful for displaying data or information that changes continuously over time. Another name for a line graph is a line chart.
View full question & answer
MCQ 461 Mark
Which of the following point will lie on $x-$axis?
  • A
    $(5, 9)$
  • B
    $(0, 4)$
  • $(3, 0)$
  • D
    $(6, 3)$
Answer
Correct option: C.
$(3, 0)$
In $(3, 0)$ the $x-$coordinate $3$ and $y-$coordinate is zero. So $(3, 0)$ will lie on $x-$axis.
View full question & answer
MCQ 471 Mark
Observe the following temperature time graph and answer the related questions:

What is the rise in temperature from $11$ hours to $13$ hours?
  • $1^\circ F$
  • B
    $2^\circ F$
  • C
    $4^\circ F$
  • D
    $3^\circ F$
Answer
Correct option: A.
$1^\circ F$
$104 - 103 = 1$
View full question & answer
MCQ 481 Mark
Comparison of parts of a whole may be done by a:
  • A
    Bar graph.
  • Pie chart.
  • C
    Linrar graph.
  • D
    Line graph solution.
Answer
Correct option: B.
Pie chart.
There are various ways to represent and compare the data. One of them is pie chart.
Pie chart is a pictorial representation of the data in which the whole is represented by a circle and the parts, by non$-$intersecting adjacent sectors.
Hence, comparison of parts of a whole may be done by a pie chart.
View full question & answer
MCQ 491 Mark
A graph showing two sets of data simultaneously is known as:
  • A
    pictograph
  • B
    histogram
  • C
    pie chart
  • double bar graph
Answer
Correct option: D.
double bar graph
A graph showing two sets of data simultaneously is known as a double bar graph.
View full question & answer
MCQ 501 Mark
Refer the given graph and answer the following question: A survey was conducted in a class to see how many girls and boys like a particular ice cream flavour. Which flavour ice cream is preferred equally by both boys and girls?
  • Peach
  • B
    Lemon
  • C
    Strawberry
  • D
    Vanilla
Answer
Correct option: A.
Peach
Since, for peach flavour, the number of girls and boys are equal.
View full question & answer