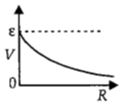
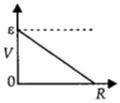
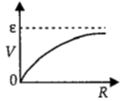
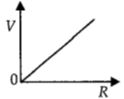
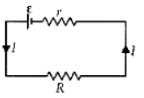
A cell having an emf $\varepsilon$ and internal resistance $r$ is connected across a variable external resistance $R.$ As the resistance $R$ is increased, the plot of potential difference $V$ across $R$ is given by
- A
- B
- C
- D
AIPMT 2012,NEET 2017, Medium


Download our appand get started for free
Experience the future of education. Simply download our apps or reach out to us for more information. Let's shape the future of learning together!No signup needed.*
Similar Questions
- 1For a cell of $e.m.f.$ $2\,V$, a balance is obtained for $50\, cm$ of the potentiometer wire. If the cell is shunted by a $2\,\Omega $ resistor and the balance is obtained across $40\, cm$ of the wire, then the internal resistance of the cell is ............. $\Omega $View Solution
- 2The length of a given cylindrical wire is increased by $100 \%$. Due to the consequent decrease in diameter the change in the resistance of the wire will be .................. $\%$View Solution
- 3A wire of resistance $160\,\Omega$ is melted and drawn in wire of one-fourth of its length. The new resistance of the wire will be $......\Omega$View Solution
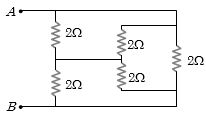
- 4Find the equivalent resistance across $AB$ .............. $\Omega$View Solution
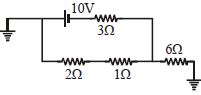
- 5Find current in $6\,\Omega $ resistanceView Solution
- 6View SolutionThe brightness of a bulb will be reduced, if a resistance is connected in
- 7View SolutionFor measurement of potential difference, potentiometer is preferred in comparison to voltmeter because
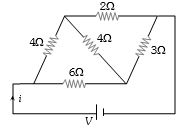
- 8For the network shown in the figure the value of the current $i$ isView Solution
- 9View SolutionWhich of the following statements is false?
- 10An infinite line charge of uniform electric charge density i. lies along the axis of an electrically conducting infinite cylindrical shell of radius $R$. At time $t=0$, the space inside the cylinder is filled with a material of permittivity $\varepsilon$ and electrical conductivity $\sigma$. The electrical conduction in the material follows Ohm's law. Which one of the following graphs best describes the subsequent variation of the magnitude of current censity $j(t)$ at any point in the material?View Solution