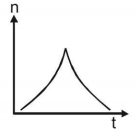
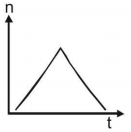
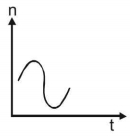
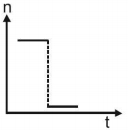
A sound source, emitting sound of constant frequency, moves with a constant speed and crosses a stationary observer. The frequency (n) of sound heard by the observer is plotted against time $( t )$. Which of the following graphs represents the correct variation?
- A
- B
- C
- D
Medium


Download our appand get started for free
Experience the future of education. Simply download our apps or reach out to us for more information. Let's shape the future of learning together!No signup needed.*
Similar Questions
- 1A source of frequency $f$ is emitting sound waves. If temperature of the medium increases, thenView Solution
- 2In a resonance tube, the first resonance is obtained when the level of water in the tube is at $16\,cm$ from the open end. Neglecting end correction, the next resonance will be obtained when the level of water from the open end is .... $cm$View Solution
- 3View SolutionApparatus used to find out the velocity of sound in gas is
- 4A person feels $2.5\%$ difference of frequency of a motor-car horn. If the motor-car is moving to the person and the velocity of sound is $320\, m/sec,$ then the velocity of car will beView Solution
- 5If the velocity of sound in air is $336 m/s$. The maximum length of a closed pipe that would produce a just audible sound will beView Solution
- 6View SolutionA musical scale is constructed by providing intermediate frequencies between a note and its octave which
- 7Two sirens situated one kilometer apart are producing sound of frequency $330 Hz$. An observer starts moving from one siren to the other with a speed of $2 m/s$. If the speed of sound be $330 m/s$, what will be the beat frequency heard by the observerView Solution
- 8Two waves of amplitudes $A_0$ and $x A_0$ pass through a region. If $x > j _0$ the difference in the maximum and minimum resultant amplitude possible isView Solution
- 9The equation $\overrightarrow {\phi \,} (x,\,t) = \overrightarrow {j\,} \sin \,\left( {\frac{{2\pi }}{\lambda }v\,t} \right)\cos \,\left( {\frac{{2\pi }}{\lambda }x} \right)$ representsView Solution
- 10A plane progressive wave is given by $y=2 \cos 2 \pi(330 t-x) m$. The frequency of the wave is:View Solution