An economy is in equilibrium. From the following data about an economy, calculate investment expenditure:
- Income = 10000
- Marginal propensity to consume = 0.9
- Autonomous consumption = 100
CBSE DELHI - SET 2 2017
Download our app for free and get started
$\text{Y}=\overline{\text{C}}+\text{MPC}\left({\text{Y}}\right)+\text{I}$$10000=100+0.9+(10000)+{\text{I}}$
$\text{I} = 10000-100-9000$
$=900$
$\text{I} = 10000-100-9000$
$=900$

Download our appand get started for free
Experience the future of education. Simply download our apps or reach out to us for more information. Let's shape the future of learning together!No signup needed.*
Similar Questions
- 1View SolutionWhat is ex-Ante consumption? Distinguish between autonomous consumption and induced consumption.
- 2View SolutionExplain the relationship between marginal propensity to consume and investment multiplier.
- 3View SolutionAn economy is in equilibrium. Find Marginal Propensity to Consume from the following:
National income = 2000
Autonomous consumption = 400
Investment expenditure = 200 - 4View SolutionWhat is investment multiplier? Explain its working using a suitable numerical example.
- 5View SolutionExplain the meaning of deflationary gap with the help of a diagram.
OR
Explain with the help of a diagram the concept of deficient demand in macroeconomics. - 6View SolutionDifferentiate between APC and MPC.
- 7View SolutionExplain the working of investment multiplier with the help of an example.
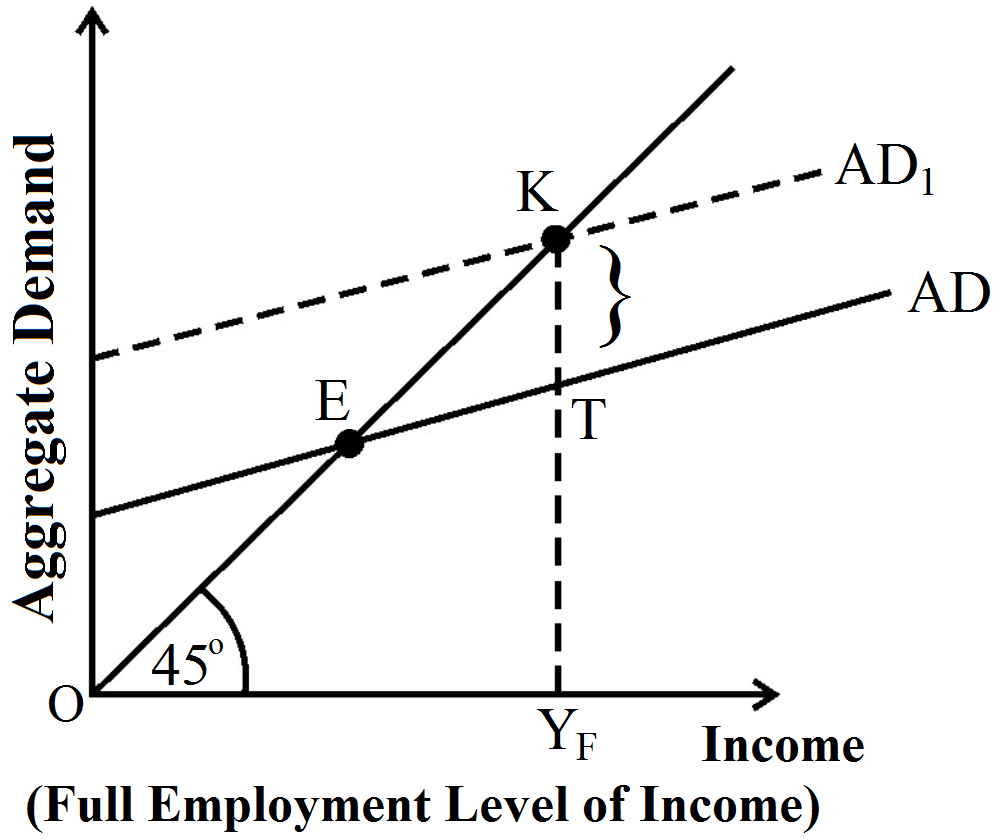
- 8View SolutionIn the given figure, what does the gap ‘KT’ represent? State any two fiscal measures to correct the situation.
- 9View SolutionExplain the meaning of inflationary gap. Explain any two measures of correcting it.
OR
Explain and graphically represent the concept of inflationary gap. Explain any one measure of removing this gap. - 10View SolutionExplain the national income determination in an economy using saving and investment approach. Use diagram.