Explain the national income determination in an economy using saving and investment approach. Use diagram.
CBSE OUTSIDE DELHI RE- PAPER SET 2 2018
Download our app for free and get started
According to the saving-investment approach, equilibrium is attained at the point where planned saving is equal to planned investment.
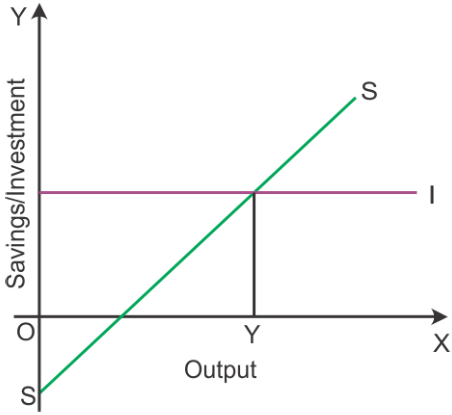
According to the diagram, equilibrium is attained at Point E, where the saving curve SS intersects the investment curve I. Corresponding to this, the equilibrium level of output is OY.
In case of any deviation from the equilibrium level of output, a readjustment would start which would again bring back the economy to equilibrium.
If planned saving is more than planned investment, then there would be a rise in the level of inventory. To correct the situation, firms would reduce output and employment till investment and saving become equal to each other.
On the other hand, if planned saving is less than planned investment, then there would be a fall in the level of inventory. To correct the situation, firms would increase output and employment till investment and saving become equal to each other.

Download our appand get started for free
Experience the future of education. Simply download our apps or reach out to us for more information. Let's shape the future of learning together!No signup needed.*
Similar Questions
- 1View SolutionWhat is APC? How is it calculated?
- 2View SolutionAs a result of increase in investment by ₹ 125 crore national income increases by ₹ 500 crore. Calculate marginal propensity to consume.
- 3View SolutionExplain the relationship between marginal propensity to consume and investment multiplier.
- 4View SolutionAn economy is in equilibrium. From the following data, calculate the marginal propensity to save:
- Income = 10,000
- Autonomous consumption = 500
- Consumption expenditure = 8,000
- 5View SolutionDefine full employment in an economy. Discuss the situation when aggregate demand is more than aggregate supply at full employment income level.
- 6View SolutionThe break-even level of income for an economy is given to be ₹ 5000 crore. If the economy saves 50 percent of additional income, calculate the value of autonomous consumption.
- 7View SolutionAn economy is in equilibrium. Find 'autonomous consumption' from the following:
National Income = 1,000 Marginal Propensity to consume = 0.8 investment expenditure = 100 - 8View SolutionExplain the meaning of deflationary gap with the help of a diagram.
OR
Explain with the help of a diagram the concept of deficient demand in macroeconomics. - 9View SolutionDifferentiate between full employment and underemployment equilibrium.
- 10View SolutionAn economy is in equilibrium. From the following data about an economy, calculate investment expenditure:
- Income = 10000
- Marginal propensity to consume = 0.9
- Autonomous consumption = 100