Question
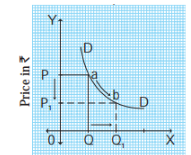
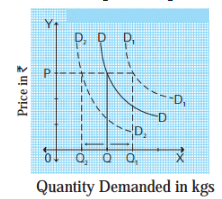
Diagram A represents ……………. in demand
Generate a complete, print-ready paper with questions like this in minutes — across 16+ boards, with answer keys.
| Price in Rs. | Quantity supplied in units |
| 10 | 200 |
| 15 | ……… |
| 20 | 300 |
| 25 | 350 |
| 30 | …….. |
| 35 | …….. |
| 40 | …….. |
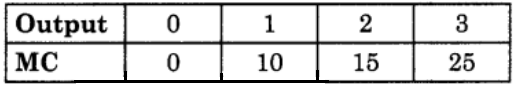
TFC (Total Fixed Cost) of a commodity ‘x’ of a firm is ₹ 20 Calculate (a) TVC and (b) TC from the following data.