Question

Image
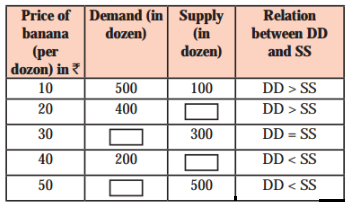
Fill in the blanks in the above schedule.

Answer

Get the step-by-step solution for this question inside the Vidyadip app.

Get the answer in the app

Need a full question paper?

Generate a complete, print-ready paper with questions like this in minutes — across 16+ boards, with answer keys.

Start Generating Free

Similar questions

Draw the market supply curve from the schedule and explain it.
Share of top Five Commodities in India’s Export 2018-19
Image
QU 1. Name the second largest exported commodity in the year 2018-19.
QU 2. How much is the share of drug formulations, biologicals (chemical products) in total export of India.
QU 3. Which commodity has least share in the total export of India and how much was it?
QU 4. Give your opinion on India’s export.

Increase and decrease in demand comes under …………….
Complete the above supply schedule.
Which organisation has the least share in the direction of India’s imports in 2015-16?
Study the below table and answer the given questions.

Image
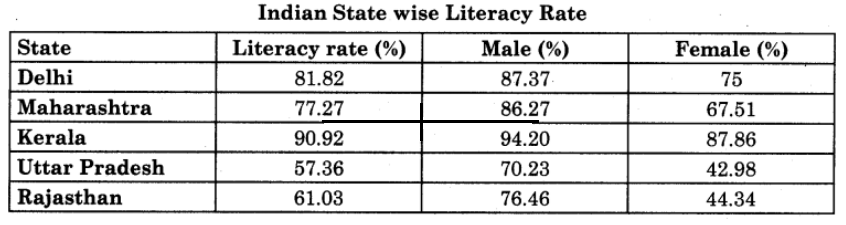
(1) Which state has the highest literacy [ rate?
(2) What is the male literacy rate for1 Maharashtra?
(3) What is difference of female literacy rate between Delhi and Rajasthan?
(4) Which states has highest male literacy and lowest female literacy rate?

Leftward shift in demand curve …………….
Explain the diagrams:

Image

Study the following table and answer the question.

Table A : Trade data for period 2009 – 10 to 2017 – 18
Image
QU 1. In which year export growth was least and how much?
QU 2. In which year import growth was maximum and how much?
QU 3. During which year trade balance was minimum?
QU 4. Which concept of Balance of Trade is applicable here?
QU 5. How much was India’s export value in the year 2017-18?
QU 6. Give your opinion on India’s foreign trade.
Rightward shift in demand curve …………….