Question
Draw the market supply curve from the schedule and explain it.
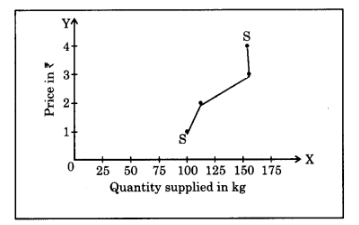
When the schedule is plotted on the graph we get a market supply curve ‘SS’ which is upward sloping. This curve shows that as price rises from ₹ 1 to ₹ 2, supply rises from 1oo to 112 kg, but when price rises from ₹ 2 to ₹ 3, supply rises to a greater extent from 112 kg to 155 kg in the market. When price rises to ₹ 4 Supply falls from 155 kg to 154 kg. This may be because of perishable or seasonal good that supply could not Jj be increased and supply falls. This show backward bending supply curve, showing partly an exception to the supply curve.
Generate a complete, print-ready paper with questions like this in minutes — across 16+ boards, with answer keys.
| Price in Rs. | Quantity supplied in units |
| 10 | 200 |
| 15 | ……… |
| 20 | 300 |
| 25 | 350 |
| 30 | …….. |
| 35 | …….. |
| 40 | …….. |