Maharashtra BoardEnglish MediumSTD 12 ScienceChemistrySolutions4 Marks
Question
Explain with diagram the boiling point elevation in terms of vapour pressure lowering.
✓
Answer
(1) The boiling point of a liquid is the temperature at which the vapour pressure of the liquid becomes equal to the external pressure, generally $1$ atm $(101.3 \times 10^3 Nm^{-2})$.
(2) When a liquid is heated, its vapour pressure rises till it becomes equal to the external pressure.
If the liquid has a low vapour pressure, it has a higher boiling point.
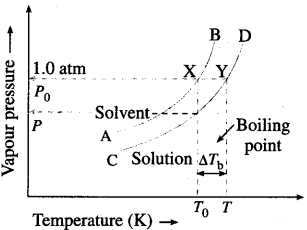
Vapour pressure curve showing elevation in boiling point
(3) When a nonvolatile solute is added to a solvent, its vapour pressure decreases, hence the boiling point increases.
This is explained by graphical representation of the vapour pressure and the boiling point of the pure solvent and the solution.
If $T_0$ and T are the boiling points of a pure solvent and a solution, then the elevation in the boiling point is given by,
$\triangle T_b = T – T_0$
The curve AB, represents the variation in the vapour pressure of a pure solvent with temperature while curve CD represents the variation in the vapour pressure of the solution.
(4) This elevation in the boiling point is proportional to the lowering of the vapour pressure, i.e., $P_0 – P$, where $P_0$ and $P$ are the vapour pressures of the pure solvent and the solution.
$[\triangle T_b ∝ (P_0 – P) or \triangle T_b ∝ \triangle P]$
Need a full question paper?
Generate a complete, print-ready paper with questions like this in minutes — across 16+ boards, with answer keys.