Question
In the given figure, ABCD is a rectangle in which diagonal AC is produced to E. If $\angle\text{ECD}=146^\circ,$ find $\angle\text{AOB}.$

Answer

ABCD is a rectangle With diagonal AC produced to point E. 
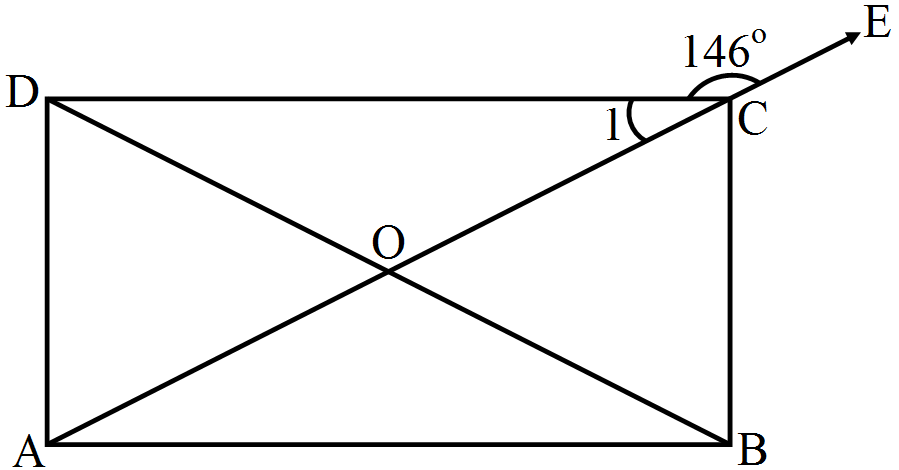
We have$\angle1+\angle\text{DCE}=180^\circ$ (Linear pair)
$\angle1+146^\circ=180^\circ$
$\angle1=34^\circ$
We know that the diagonals of a parallelogram bisect each other. Thus OC = OD Also, angles opposite to equal sides are equal. Therefore,$\angle\text{ODC}=34^\circ$
By angle sum property of a traingle$\angle\text{ODC}+\angle1+\text{COD}=180^\circ$
$34^\circ+34^\circ+\text{COD}=180^\circ$
$68^\circ+\angle\text{COD}=180^\circ$
$\angle\text{COD}=112^\circ$
Also, $\angle\text{COD}$ and $\angle\text{AOB}$ are vertically opposite angles. Therefore, $\angle\text{AOB}=112^\circ$ Hence, the required measure for $\angle\text{AOB}$ is 112º.

Need a full question paper?

Generate a complete, print-ready paper with questions like this in minutes — across 16+ boards, with answer keys.

Start Generating Free

Similar questions

Find rational numbers a and b such that:$\frac{\sqrt{3}+\sqrt{2}}{\sqrt{3}-\sqrt{2}}=\text{a}+\text{b}\sqrt{6}$
If $\text{x}=3+\sqrt8,$ find the value of $\text{x}^2+\frac{1}{\text{x}^2}.$
A chord of a circle is equal to the radius of the circle. Find the angle subtended by the chord at a point on the minor arc and also at a point on the major arc.
Read the bar graph given in figure and answer the following questions:
  1. What information is given by the bar graph?
  2. What was the expenditure on health and family planning in the year $1982-83$?
  3. In which year is the increase in expenditure maximum over the expenditure in the previous year? What is the maximum increase?
ABC is a triangle and through A, B, C lines are drawn parallel to BC, CA and AB respectively intersecting at P, Q and R. Prove that the perimeter of $\triangle\text{PQR}$ is double the perimeter of $\triangle\text{ABC}.$
If $\frac{9^\text{n}\times3^2\times\Big(3^\frac{-\text{n}}{2}\Big)^{-2}-(27)^\text{n}}{3^{3\text{m}}\times2^3}=\frac{1}{27},$ prove that m - n = 1.
Visualize the representation of $4.\overline{67}$ on the number line up to 4 decimal places.
The mean of nine numbers is 77. If one more number is added to it, then the mean increases by 5. Find the number added in the data.
In the given figure, l || m and a transversal t cuts them, If $\angle1:\angle2=2:3,$ find the measure of each of the remaining marked angles.
The time taken, in seconds, to solve a problem by each of 25 pupils is as follows:
16, 20, 26, 27, 28, 30, 33, 37, 38, 40, 42, 43, 46, 46, 46, 48, 49, 50, 53, 58, 59, 60, 64, 52, 20
  1. Construct a frequency distribution for these data, using a class interval of 10 seconds.
  2. Draw a histogram to represent the frequency distribution.