Question
Population characteristics in Stage 1 and Stage 2 in Demographic Transition theory
| Stage 1 | Stage 2 |
| (i) Both birth rates and death rates are high. | (i) Birth rates are constant and death rates are declining. |
| (ii) Population growth is stable. | (ii) Population grows rapidly. |
| (iii) Low sanitation, high occurrence of contagious diseases. | (iii) Efforts are made to control and combat diseases. |
| (iv) Due to lack of medical facilities and malnutrition mortality rate is high. | (iv) Reduction in mortality rate. |
| (v) People depend on agriculture and other primary activities. | (v) Secondary activities and transport developed |
| (vi) No country falls in this category. | (vi) Most of the developing countries fall in this category. |
Generate a complete, print-ready paper with questions like this in minutes — across 16+ boards, with answer keys.

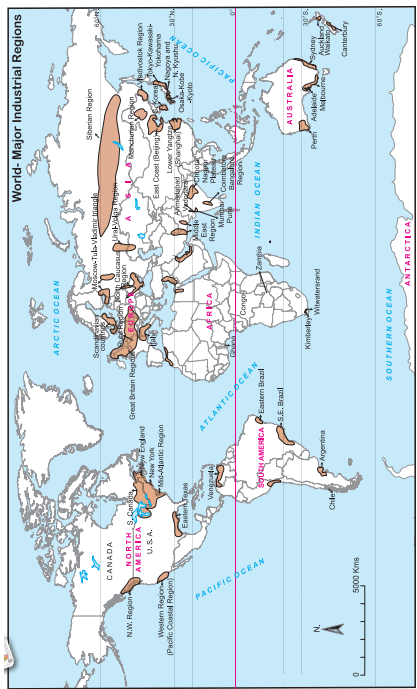
Observe the map and an swer the following questions
(i) Which economic activities are shown in the following map?
(ii) In which region do you don’t find any activity? what could be the reason?
(iii) In which latitudes do you primarily find the distribution of lumbering activity?
(iv) Why is fishing occupation only found in certain areas in the oceans?
(v) Which primary economic activities are mostly found in Europe?

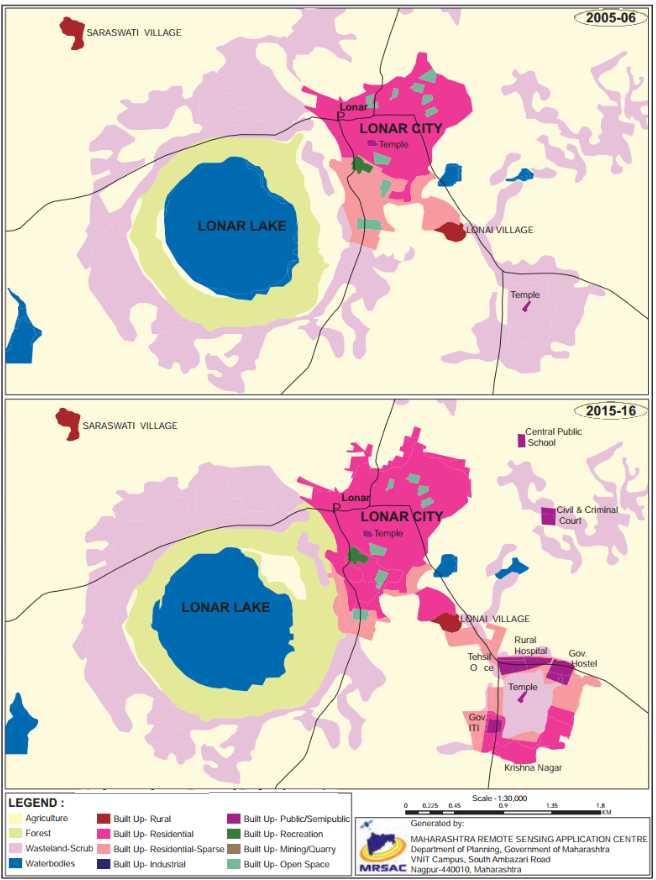
(i) Which periods do the map belongs to?
(ii) Which land covers have reduced? What are their colours?
(iii)Which landcovers seen to have increased? what are their colours?
(iv) Which land cover has been replaced by increased landcovers?
(vi) Write a conclusive note comparing both the maps.
| A | B | C |
| (1) Climate | (1) Soil | (1) Import food |
| (2) Natural Resources | (2) High density | (2) Woollen products |
| (3) Population | (3) Dry farming | (3) Agriculture |
| (4) Culture | (4) Snow covered area | (4) Kashmiri shawl |
| (5) Israel | (5) Art and craft | (5) Export services for agriculture |
| Regions | Contribution of Primary Sector to GDP (%) | Contribution of Secondary Sector to GDP (%) | Contribution of Tertiary Sector to GDP (%) | Human Development Index (HDI) |
| 2018 | 2018 | 2018 | 2018 | |
| A | 1 | 34 | 65 | 0.93 |
| B | 2 | 32 | 66 | 0.85 |
| C | 2 | 37 | 61 | 0.71 |
| D | 6 | 33.2 | 60.8 | 0.81 |
| E | 14 | 30 | 56 | 0.65 |
(i) In which region is contribution of primary activities the least?
(ii) In which region is the contribution of primary activities the most?
(iii) In which region the contribution of tertiary activities is the most?
(iv) Which region has the highest HDI?
(v) Can you draw a conclusion on basis of the answers from Q (i) to Q (iv)?
| A | B | C |
| (1) Climate | (1) Skills | (1) Information technology |
| (2) Population | (2) Tropical | (2) Tea, Coffee export |
| (3) Culture | (3) Poor soil | (3) Export oil |
| (4) Gulf countries | (4) Art and craft | (4) Chinese porcelain |