Question
| A | B | C |
| (1) Climate | (1) Skills | (1) Information technology |
| (2) Population | (2) Tropical | (2) Tea, Coffee export |
| (3) Culture | (3) Poor soil | (3) Export oil |
| (4) Gulf countries | (4) Art and craft | (4) Chinese porcelain |
| A | B | C |
| (1) Climate | (1) Skills | (1) Information technology |
| (2) Population | (2) Tropical | (2) Tea, Coffee export |
| (3) Culture | (3) Poor soil | (3) Export oil |
| (4) Gulf countries | (4) Art and craft | (4) Chinese porcelain |
| A | B | C |
| (1) Climate | (1) Tropical | (1) Tea, Coffee export |
| (2) Population | (2) Skills | (2) Information technology |
| (3) Culture | (3) Art and craft | (3) Chinese porcelain |
| (4) Gulf countries | (4) Poor soil | (4) Export oil |
Generate a complete, print-ready paper with questions like this in minutes — across 16+ boards, with answer keys.

| Regions | Contribution of Primary Sector to GDP (%) | Contribution of Secondary Sector to GDP (%) | Contribution of Tertiary Sector to GDP (%) | Human Development Index (HDI) |
| 2018 | 2018 | 2018 | 2018 | |
| A | 1 | 34 | 65 | 0.93 |
| B | 2 | 32 | 66 | 0.85 |
| C | 2 | 37 | 61 | 0.71 |
| D | 6 | 33.2 | 60.8 | 0.81 |
| E | 14 | 30 | 56 | 0.65 |
(i) In which region is contribution of primary activities the least?
(ii) In which region is the contribution of primary activities the most?
(iii) In which region the contribution of tertiary activities is the most?
(iv) Which region has the highest HDI?
(v) Can you draw a conclusion on basis of the answers from Q (i) to Q (iv)?
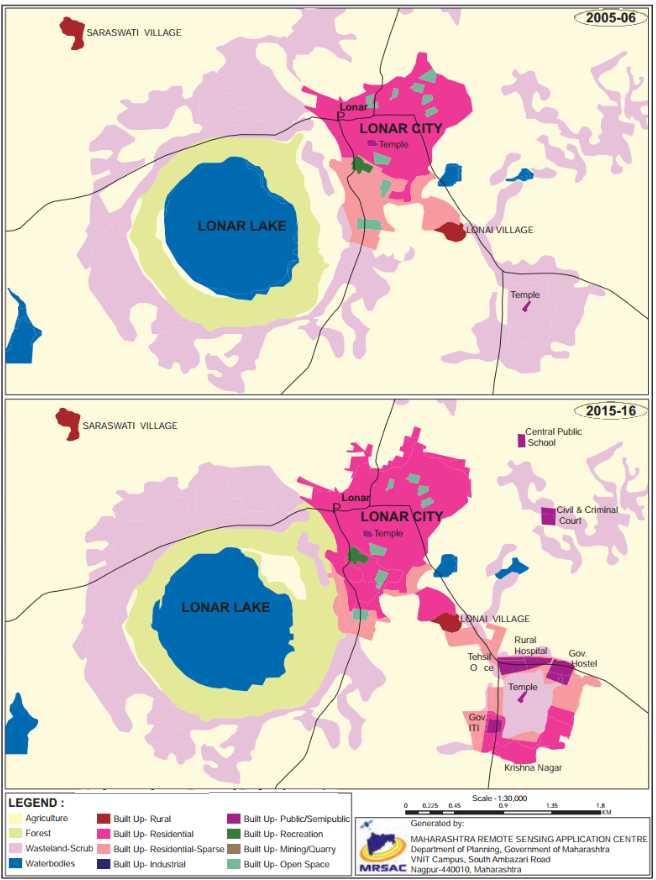
(i) Enlist the colours used for showing land uses in the index.
(ii) What do the blue and black lines show?
(iii) What is the name of the river in the map?
(iv) Name any two villages shown on the map.
(v) Which city is shown on the map?