Question
Stage 5 of Demographic Transition Theory.

Answer

  • Stage 5 in Demographic Transition Theory is the last stage.
  • In this stage the birth rate is very low and death rate is high. Therefore, the growth of population is slow or negative growth of population is seen.
  • Due to large number of old people the death rate is high and due to a smaller number of young people birth rate is low.
  • Tertiary activities are more developed and they contribute more to the economy.
  • The standard of living of people is high, economic condition of the country is good.
  • In this stage government provides high quality educational and medical facilities.
  • Overall people are happy due to healthy environment and comfortable life.
  • For example, Norway, Sweden, Finland are in this stage.

Need a full question paper?

Generate a complete, print-ready paper with questions like this in minutes — across 16+ boards, with answer keys.

Start Generating Free

Similar questions


Image
(1)Which means of transportation are shown in the map?
(2)Between which continents do you see an overall higher flow of transportation?
(3)Which canals can you see in their waterways? What can be the purpose?
(4)Which two major cities in India are connected internationally through airways?
(5)Which two continents show lesser use of air routes? Why?
Population characteristics in Stage 1 and Stage 2 in Demographic Transition theory

Image

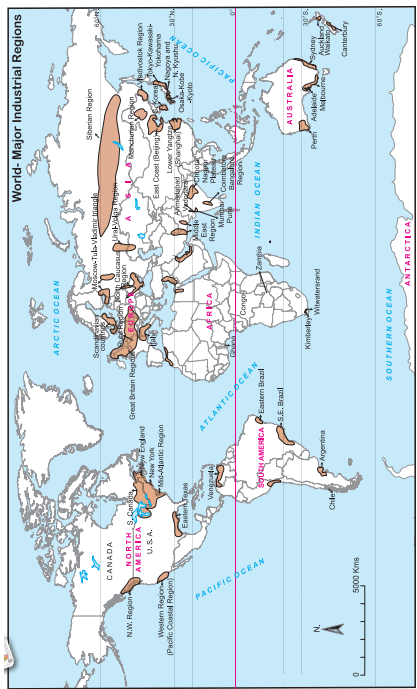
Observe the map and an swer the following questions

(i) What production does the symbol of mining shown in seas and oceans depict?
(ii) In which continent mining is not found?
(iii) In which ocean is the world’s fishing mostly carried out?
(iv) Which primary economic activities are found to the south of Tropic of Capricorn?
(vi) Which primary activity is found in the islands of South East Asia?

Many countries are considering to increase retirement age.
See map of Ichalkaranji city and observe how changes have occurred in the city over the years. Answer the questions that follow.

Image


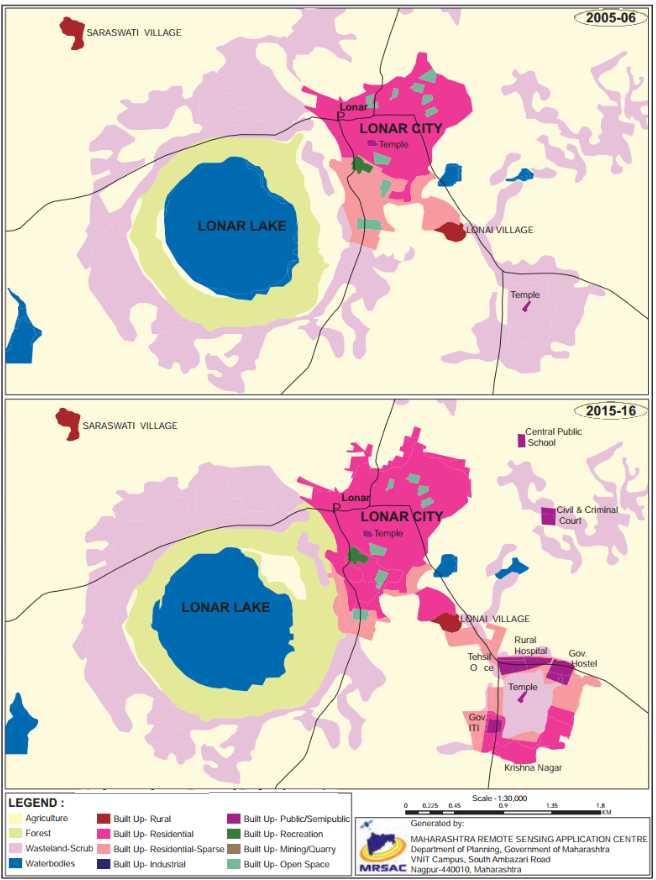
(i) Enlist the colours used for showing land uses in the index.
(ii) What do the blue and black lines show?
(iii) What is the name of the river in the map?
(iv) Name any two villages shown on the map.
(v) Which city is shown on the map?

Study the given map in fig and answer the following questions.Image
(i) In which hemisphere do you find more concentration of industries?
(ii) In which part of North America has the industrial region been mainly developed?
(iii) In which part of Europe is concentration of industries mainly found?
(iv) Why is less industrial development found in other parts of African continent except coastal areas?
(v) In which part of India do you find concentration of industries?
(vi) Why do you think coastal areas have higher concentration industries?
(vii) Write a concluding paragraph on latitudinal distribution of industries in the world.
Impact of mining on distribution of population.
Early expanding stage and Late expanding stage
Explain the human factors affecting distribution of population.
ABC
(1) Climate(1) Soil(1) Import food
(2) Natural Resources(2) High density(2) Woollen products
(3) Population(3) Dry farming(3) Agriculture
(4) Culture(4) Snow covered area(4) Kashmiri shawl
(5) Israel(5) Art and craft(5) Export services for agriculture