Question
Prepare a simple bar graph with the help of given statistical information and answer the questions given below-

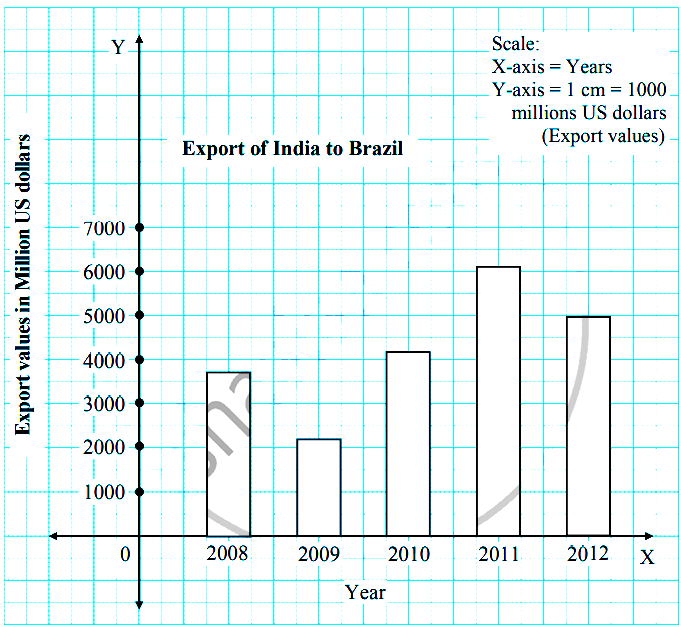
Export of India to Brazil (million US dollars)

Year Export
2008 3700
2009 2200
2010 4200
2011 6100
2012 5000

Questions-

  1. How much export was found in 2008?
  2. In which year highest export of India was found?
  3. How much export increased in millions between 2009 and 2011?

Answer


  1. In 2008, export was 3700 million US dollars.
  2. Highest export of India was found in the year 2011.
  3. Export increased by 3900 million US dollars between 2009 and 2011.

Need a full question paper?

Generate a complete, print-ready paper with questions like this in minutes — across 16+ boards, with answer keys.

Start Generating Free

Similar questions

Read the graph and answer the following questions:
Image

Questions:
1. Name the sectors mentioned in the graph.
2. Which sector contributes the highest in National income in India?
3. How much percent of population is engaged in primary sector in Brazil?
4. Out of given two countries, the share of primary sector to the national income is less.
Read the graph in fig below and answer the following questions:

  1. What was the percentage of urbanisation in 1961?
  2. In which decade was urbanisation the highest?
  3. In which decade was the growth of urbanisation lowest?
  4. What inference can you draw regarding India’s urbanisation after reading the graph?
  5. In which decade is the percentage of urbanization 27.8?
  6. What is the difference between the percentage of urbanisation from 1971 and 1981?

Read the graph and answer the following questions:
Image
1. What does the above graph show?
2. In which age group population is more?
3. What is the class interval of the data shown on ' Y ' axis?
4. In the age group of above 60 years whose population is more, male or female?
Prepare a simple bar graph with the help of given statistical information and answer the questions given below-

Brazil-life expectancy

Years Life expectancy
1960 54
1970 59
1980 61
1990 65
2000 70
2010 73
2016 75

Questions-

  1. What is the interval of years in the data?
  2. What is the difference in life expectancy of 1960 and 2016?
  3. Write five sentences about the analysis of graph.
Observe the following graph and answer the questions given below-

  1. Which country has a higher percent of the population engaged in primary activities?
  2. In which country is the contribution of tertiary sector greater in the GDP?
  3. In which country is the share of secondary activities more in the GDP?
  4. Can we say that Brazil is an agrarian economy like India? Give reasons.
  5. Which country has a higher percent of the population engaged in secondary activities?
  6. How muchpercent of population is engaged in tertiary activities in India?
India-Literacy Rate Percentage (1981 to 2016)
Year% of Literacy
198140.8
199148.2
200161.0
201169.3
201672.2
Questions:
(1) What does the graph indicate ?
(2) What was the literacy rate in the year 1991?
(3) How much was an increase in literacy rate in the decade from 1991 to 2001?