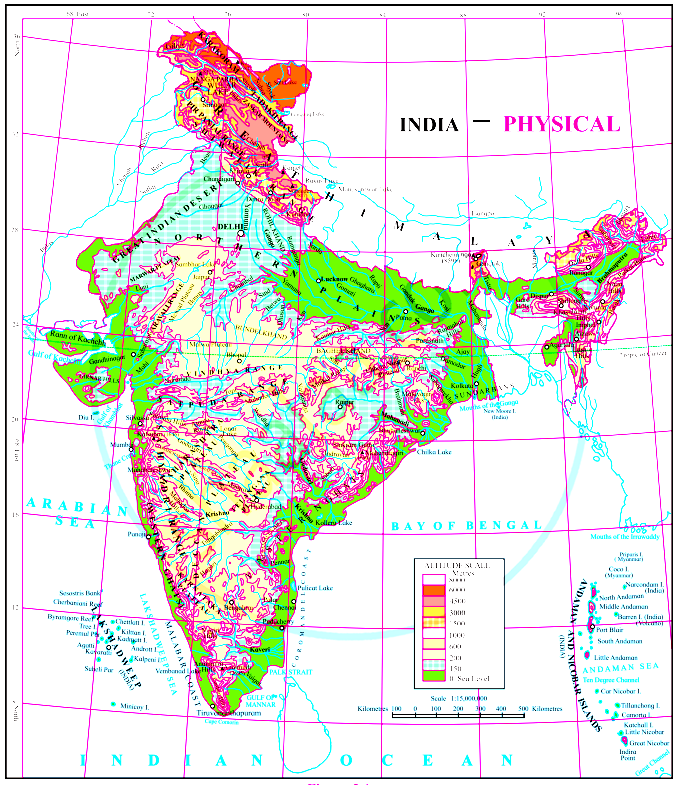
To the foothills of the Aravalis $...........$
- Alies the Bundelkhand Plateau.
- ✓lies the Mewad Plateau.
- Clies the Malwa Plateau.
- Dlies the Deccan Plateau.
Answer: B.
View full solution →227 questions across 14 question groups — pick any mix to generate a Social Studies paper with step-by-step answer keys.
MCQ
24 Q→02Answer the following in one sentence
27 Q→03Answer the following questions in details.
6 Q→04Give geographical reasons for the following
33 Q→05Write short notes
22 Q→06Anwer in brief
32 Q→07Are the sentences right or wrong. Rewrite the wrong ones
29 Q→08Identify the correct group
11 Q→09Identify the type on the basis of the statement
3 Q→10Distinguish between
17 Q→11Graph
8 Q→12Maps
9 Q→13Match the following
3 Q→14Name the following
3 Q→One sample from each question group in this chapter. Select any group above to see the full set with answer keys.
Answer: B.
View full solution →Answer: A.
View full solution →Answer: B.
View full solution →Answer: C.
View full solution →Answer: B.
View full solution →Bihar, Tocantins, Pernambuco, Alagoas, Eastern Maharastra, Western part of Rajasthan, Gujarat, Rio Grande Do Norte, Paraiba, Western Ghats, Eastern Himalayas, Western Andhra Pradesh, Roraima, Amazonas, West Bengal, Roraima, Rio Grande do Sul, Santa Catarina, Goa.
| State | India | Brazil |
| High rainfall | ||
| Moderate rainfall | ||
| Low rainfall |
(a)
(b)
Proximity to the sea, Lack of roads, Temperate climate, Lack of industries, New cities and towns, Tropical humid forests, Minerals, Semi arid climate, Land favorable for agriculture
Amazonas, Rio de Janeiro, Alaguas, Sao Paulo, Parana
Himachal Pradesh, Uttar Pradesh, Arunachal Pradesh, Madhya Pradesh, Andhra Pradesh
The evergreen rain forests in Brazil are rightly called in ‘Lungs of the world’.
India receives precipitation from the North-East Monsoon winds too.
We rely on the sea route for international trade.
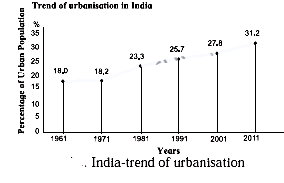
Except Delhi and Chandigarh, urbanization is low in other parts of India.
Population density is high in the Ganga plains.
Correlation between physiographic and internal waterways
Air transport in India
Modern means of communication
The Great Escarpment
Right
Wrong
Right
Wrong
The southern part of India is called Peninsula.
Right
Wrong
Right
Wrong
Temperature decreases from north to south in India.
Right
Wrong
With reference to flora of India:
Deodar
Anjan
Orchid
Banyan
Wild animal of Brazil:
Anaconda
Tamiarin
Red Panda
Lion
Forest type of India:
Mangrove forest
Mediterranean forest
Thorny bush type vegetation
Equatorial forest
Indian tree-
Deodar
Anjan
Orchid
Banyan
Forest type of Brazil:
Thorny bush type vegetation
Evergreen forests
The Himalayan Forests
Deciduous forests
Salt producing states in India:
Gujarat
Rajasthan
Bihar
Tamilnadu
Major crops of Brazil:
Cocoa
Coffee
Soyabean
Jowar
Main purpose of field visit:
Geographical
Historical
Entertainment
Cultural
Tourism in India and Brazil
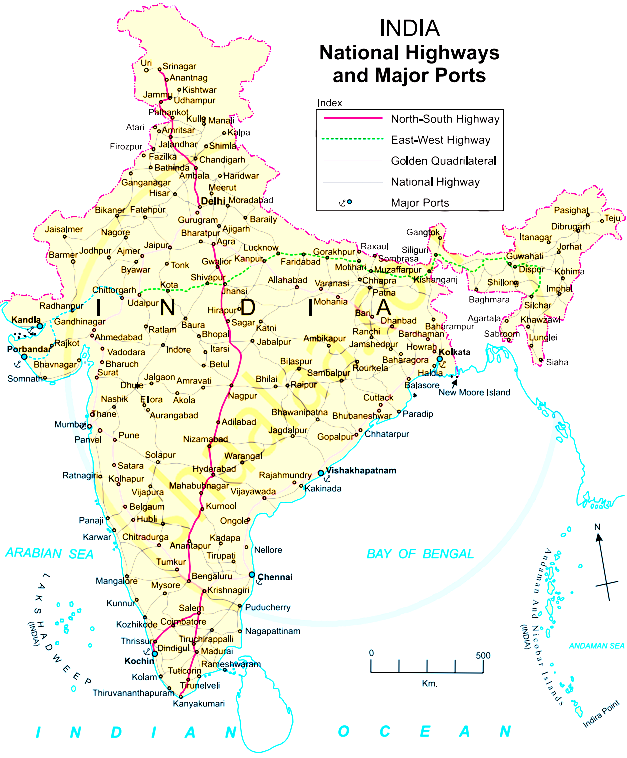
Transportation in India and Brazil
Indian standard time (IST) and Brazilian standard time (BRT)
Communication in Brazil and India
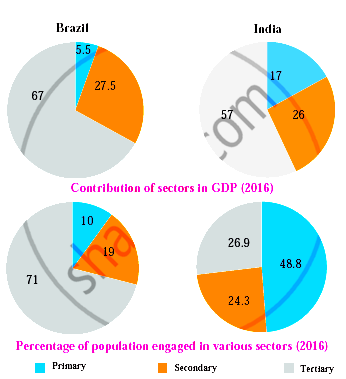
Occupations in India and Brazil
Brazil-life expectancy
| Years | Life expectancy |
| 1960 | 54 |
| 1970 | 59 |
| 1980 | 61 |
| 1990 | 65 |
| 2000 | 70 |
| 2010 | 73 |
| 2016 | 75 |
Questions-
Brazil-% of urban population
| Year | % of urban population |
| 1960 | 47.1 |
| 1970 | 56.8 |
| 1980 | 66.0 |
| 1990 | 74.6 |
| 2000 | 81.5 |
| 2010 | 84.6 |
Questions-
Brazil- % of population (2016)
Questions-
Questions-
| A | B | ||
| 1. | Trans Amazonian route | a. | Tourist spot |
| 2. | Road transportation in India | b. | Railway station in India |
| 3. | Rio de Janerio | c. | Golden quadrilateral highway |
| d. | Important transport route of Brazil |
| a) Evergreen Forests | (i) Sundar trees |
| b) Deciduous Forests | (ii) Pine |
| c) Coastal Forests | (iii) Pau Brasil |
| d) Himalayan Forests | (iv) Khejadi |
| e) Thorny and bush-type vegetation | (v) Teak |
| (vi) Orchid | |
| (vii) Sal |
| A | B | ||
| 1. | Manaus | a. | Low rainfall region |
| 2. | Rajasthan | b. | Nucleated settlements |
| 3. | Highlands of Brazil | c. | Bengal Tiger |
| 4. | North Indian Plains | d. | Animals of grasslands |
| e. | Swampy region | ||
| f. | Not much difference in the range of temperature |
The rain shadow region of Brazil which is found at the north east direction.
The activity in which visiting the place and collecting the information of geographical and cultural factors is done.
Pick question groups from the list above, set marks and difficulty, and export a branded PDF with step-by-step answer keys. First 3 chapters free — no signup.