Questions

Graph

Take a timed test

8 questions · self-marked practice — reveal the answer and mark yourself.

Question 14 Marks
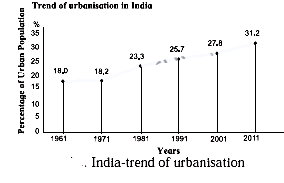
Read the graph in fig below and answer the following questions:

  1. What was the percentage of urbanisation in 1961?
  2. In which decade was urbanisation the highest?
  3. In which decade was the growth of urbanisation lowest?
  4. What inference can you draw regarding India’s urbanisation after reading the graph?
  5. In which decade is the percentage of urbanization 27.8?
  6. What is the difference between the percentage of urbanisation from 1971 and 1981?

Answer
  1. Urbanisation refers to the movement of people and human settlements from the rural areas to the urban areas. Employment opportunities, higher standard of living, better facilities and infrastructure force people to migrate from rural areas to urban areas. India experienced 18% urbanisation in 1961.
  2. Urbanisation refers to the movement of people and human settlements from the rural areas to the urban areas. Employment opportunities, higher standard of living, better facilities and infrastructure force people to migrate from rural areas to urban areas. Urbanisation was highest in 2011. It was nearly 31.2%.
  3. Urbanisation refers to the movement of people and human settlements from rural areas to urban areas. Employment opportunities, higher standard of living, better facilities, and infrastructure force people to migrate from rural areas to urban areas. The growth of urbanisation was lowest between 1961 and 1971. It was only 0.2%.
  4. Urbanisation refers to the movement of people and human settlements from rural areas to urban areas. Rapid urbanisation is taking place in India because of the rapid increase in its population. Because of the increase in its population, people require more land and other resources. Thus villages have given way to the formation of cities and have contributed to the migration of people from rural res to urban areas. Other factors like employment opportunities, a higher standard of living, better facilities and infrastructure also force people to migrate from rural areas to urban areas. Between these years, India is experiencing increasing urbanisation. In 2011, it was nearly 31.2%.
  5. In 2001, the percentage of urbanisation is 27.8.
  6. The difference between the percentage of urbanisation from 1971 and 1981 is 5.1%
View full question & answer
Question 24 Marks
Prepare a simple bar graph with the help of given statistical information and answer the questions given below-

Brazil-life expectancy

Years Life expectancy
1960 54
1970 59
1980 61
1990 65
2000 70
2010 73
2016 75

Questions-

  1. What is the interval of years in the data?
  2. What is the difference in life expectancy of 1960 and 2016?
  3. Write five sentences about the analysis of graph.
Answer

  1. The interval of the data is 10 years.
  2. The difference in life expectancy of 1960 and 2016 is 21 years.
  3. i. Life expectancy is an average number of years a person born in a country is expected to live.
    ii. The graph shows that life expectancy has increased in every decade.
    iii. The life expectancy has increased by 21 years from 1960 to 2016.
    iv. The mortality rate has reduced in the last 56 years.
    v. The life expectancy has increased due to improvement in medical facilities, progress in the medical field, access to nutritious food etc.
View full question & answer
Question 34 Marks
Observe the following graph and answer the questions given below-

  1. Which country has a higher percent of the population engaged in primary activities?
  2. In which country is the contribution of tertiary sector greater in the GDP?
  3. In which country is the share of secondary activities more in the GDP?
  4. Can we say that Brazil is an agrarian economy like India? Give reasons.
  5. Which country has a higher percent of the population engaged in secondary activities?
  6. How muchpercent of population is engaged in tertiary activities in India?
Answer
  1. India has a higher percentage of population engaged in primary activities.
  2. In Brazil, the contribution of the tertiary sector is greater in the GDP.
  3. In Brazil, the share of secondary activities is more in the GDP.
  4. No, we cannot say that Brazil is an agrarian economy like India because:
    i. In Brazil, 71% of the population is engaged in the tertiary sector while the contribution of this sector to GDP is 67%.
    ii. This shows that it has a strong and rapidly growing service sector.
  5. India has a higher percentage of population engaged in secondary activities.
  6. In India, 26.9% of the population is engaged in tertiary activities.
View full question & answer
Question 44 Marks
Prepare a simple bar graph with the help of given statistical information and answer the questions given below-

Brazil-% of urban population

Year % of urban population
1960 47.1
1970 56.8
1980 66.0
1990 74.6
2000 81.5
2010 84.6

Questions-

  1. What is the interval of years in the data?
  2. During which year did rapid urbanization start?
  3. Write five sentences about the analysis of graph.
Answer

  1. The interval of the data is 10 years.
  2. Rapid urbanisation started during the decade of 1960-1970.
  3. i. The percentage of urbanisation in Brazil from 1960-2010 is shown in the graph.
    ii. In 1960, the urbanisation was 47.1% and in the following ten years i.e. by 1970, it grew by 9.7% and reached 56.8%.
    iii. There was growth in urbanisation even after 1980, but its rate of growth reduced.
    iv. The urbanisation increased from 81.5% to 84.6% during 2000-2010, showing a mere growth of 3.1%.
    v. It is clear from the graph that there is rapid urbanisation in Brazil.
View full question & answer
Question 54 Marks
Observe the following graph and answer the questions given below-

Brazil- % of population (2016)


  1. Which type of graph is this?
  2. Which age group has the highest population?
  3. Write class interval of age groups given on Y-axis.
  4. Whose number is more in males and females of age above 60?
  5. How much percent of females are found in age group of 55 to 59 years?
  6. After which age group is the decrease in population found?
Answer
  1. This is population pyramid which shows age and sex of population.
  2. The age group of 30 to 34 years has the highest population.
  3. The class interval of age groups given on ‘Y’ axis is 5 years.
  4. In the age group of above 60 years, the number of females is more than males.
  5. In the age group of 55 to 59 years, females are more than 2%.
  6. The decrease in population is found after the age group of 30-34.
View full question & answer
Question 64 Marks
Prepare a simple bar graph with the help of given statistical information and answer the questions given below-

Export of India to Brazil (million US dollars)

Year Export
2008 3700
2009 2200
2010 4200
2011 6100
2012 5000

Questions-

  1. How much export was found in 2008?
  2. In which year highest export of India was found?
  3. How much export increased in millions between 2009 and 2011?
Answer

  1. In 2008, export was 3700 million US dollars.
  2. Highest export of India was found in the year 2011.
  3. Export increased by 3900 million US dollars between 2009 and 2011.
View full question & answer
Question 74 Marks
Prepare a line graph with the help of given statistical information and answer the questions given below-

India-trends of urbanization(%)

Year India
1961 18.0
1971 18.2
1981 23.3
1991 25.7
2001 27.8
2011 31.2

Questions-

  1. In which year 18% urbanization is found?
  2. Urbanization has increased by how many percent from 2001 to 2011?
  3. In which decade was the growth of urbanization highest?
Answer
https://pg-data.sgp1.cdn.digitaloceanspaces.com/shaalaa/_4_d3d6a126dfe4476bb8f118b697f6443f.png" width="432" height="" />
  1. 18% urbanisation is found in the year 1961.
  2. Urbanisation has increased by 3.4% from 2001 to 2011.
  3. The growth of urbanisation was highest in the decade of 1971 to 1981.
View full question & answer
Question 84 Marks
Observe the following graph and answer the questions given below-

India- % of population (2016)

  1. Which type of graph is this?
  2. Which age group has the highest population?
  3. Write class interval of age groups given on Y-axis.
  4. Whose number is more in males and females of age above 60?
  5. How much percent of females are found in age group of 55 to 59 years?
  6. After which age group is the decrease in population found?
Answer
  1. This is the population pyramid, which shows age and sex of population.
  2. The age group of 10 to 14 years has the highest population.
  3. The class interval of age groups given on ‘Y’ axis is 5 years.
  4. In the age group of above 60 years, the percentage of the male and female population is almost the same.
  5. In the age group of 55 to 59, 2% females are found.
  6. The decrease in population is found after the age group of 15 to 19.
View full question & answer