Question
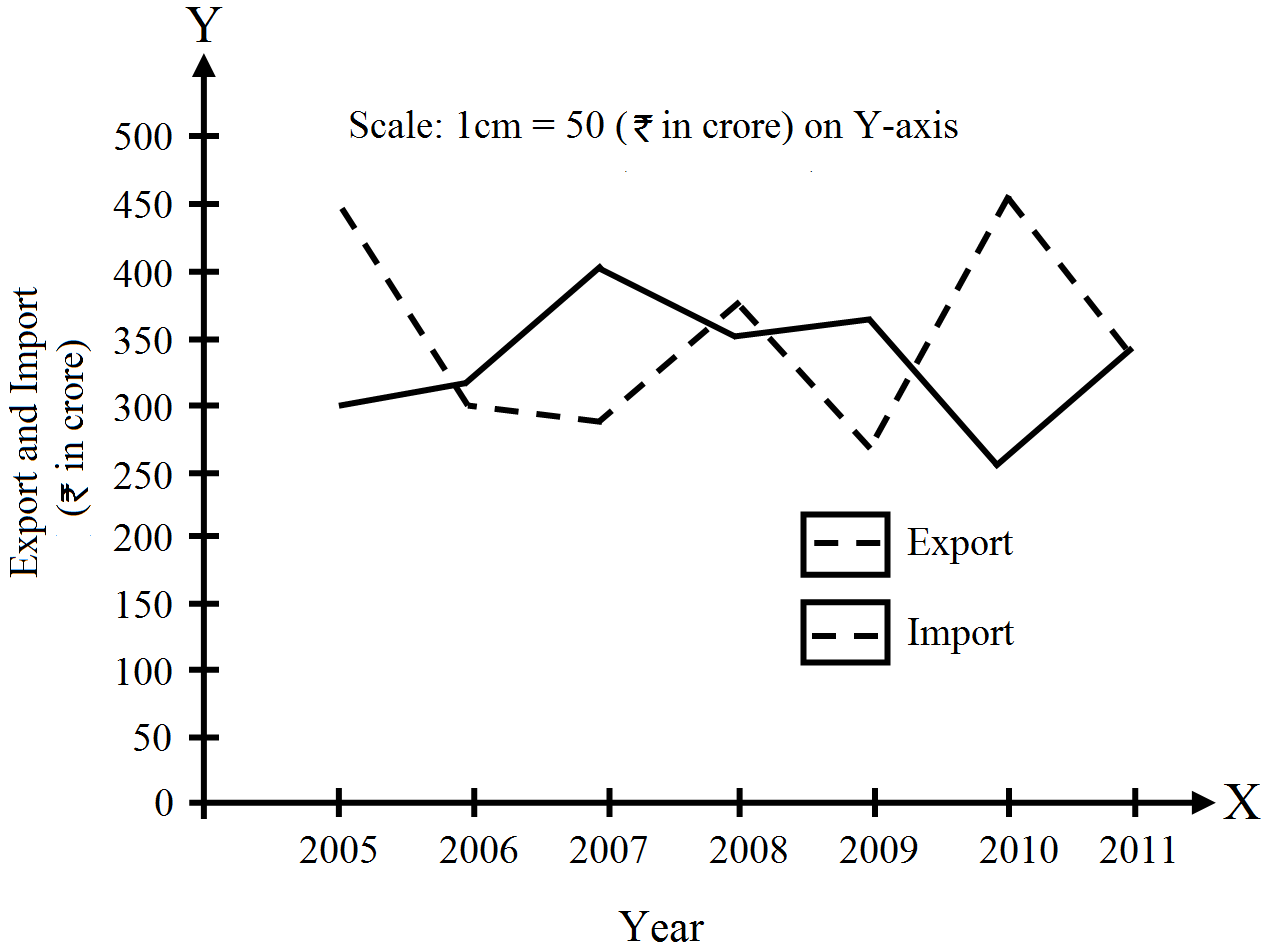
Represent the following information through a time series graph.
|
Year
|
2005
|
2006
|
2007
|
2008
|
2009
|
2010
|
2011
|
|
Export (₹ in crore)
|
300
|
320
|
400
|
350
|
360
|
250
|
340
|
|
Imort (₹ in crore)
|
450
|
300
|
280
|
375
|
330
|
450
|
325
|