Question
Explain the human factors affecting distribution of population.

Answer

Important human factors affecting distribution of population are
(i) Agriculture
(ii) Mining
(iii) Transportation
(iv) Urbanisation
(v) Government policy

(i) Agriculture

  • Due to use of fertilizers and irrigation facilities, agricultural production increases and it supports large number of people.
  • The method of cultivation, crops grown, types of agriculture and specialisation in particular crop are the other factors that affects the distribution of population.

(ii) Mining

  • Minerals are the important raw materials for the development of industries.
  • Industries develop in mineral rich areas and generate employment for skilled and unskilled labour. People are attracted in such areas and thus density of population increases.
  • For example, richest mineralised zone of India – Chota Nagpur region in India is densely populated.

(iii) Transportation

  • Regions having well developed network of transportation facilities are densely populated.
  • Transportation network increases accessibility and helps to develop industries and generate employment and increases density of population.
  • On the other hand, the areas where transport facilities are not developed, movement of goods and people become difficult and time consuming and therefore density of population is less.

(iv) Urbanisation

  • Due to the development of industries, there is growth of towns and cities.
  • In cities transportation, trade and other tertiary activities develop on large scale to fulfil the needs of increasing population.
  • People are attracted to city areas due to better employment opportunities, educational and medical facilities, development of means of transport and communication and thus population goes on increasing. For e.g. Mumbai, London, Tokyo, New York.

(v) Government policy

  • There is direct effect of government policies on density and distribution of population.
  • Sometimes the government encourages people to settle in certain areas to reduce the pressure of population in certain cities. The government provides incentives to attract people.
  • For example, to reduce overcrowding in Mumbai city, government provided land, water, and power at concessional rate in New Mumbai area.

Need a full question paper?

Generate a complete, print-ready paper with questions like this in minutes — across 16+ boards, with answer keys.

Start Generating Free

Similar questions

Age structure affects economy of the country.
Study the given map in fig and answer the following questions.Image
(i) In which hemisphere do you find more concentration of industries?
(ii) In which part of North America has the industrial region been mainly developed?
(iii) In which part of Europe is concentration of industries mainly found?
(iv) Why is less industrial development found in other parts of African continent except coastal areas?
(v) In which part of India do you find concentration of industries?
(vi) Why do you think coastal areas have higher concentration industries?
(vii) Write a concluding paragraph on latitudinal distribution of industries in the world.
Causes of migration
ABC
(1) Climate(1) Skills(1) Information technology
(2) Population(2) Tropical(2) Tea, Coffee export
(3) Culture(3) Poor soil(3) Export oil
(4) Gulf countries(4) Art and craft(4) Chinese porcelain
Early expanding stage and Late expanding stage

Image

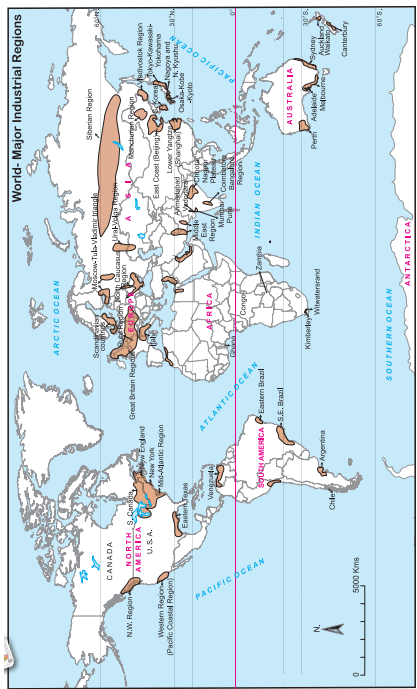
Observe the map and an swer the following questions

(i) What production does the symbol of mining shown in seas and oceans depict?
(ii) In which continent mining is not found?
(iii) In which ocean is the world’s fishing mostly carried out?
(iv) Which primary economic activities are found to the south of Tropic of Capricorn?
(vi) Which primary activity is found in the islands of South East Asia?

Many countries are considering to increase retirement age.
Population characteristics in Stage 4 and Stage 5 in Demographic Transition Theory.
See map of Ichalkaranji city and observe how changes have occurred in the city over the years. Answer the questions that follow.

Image

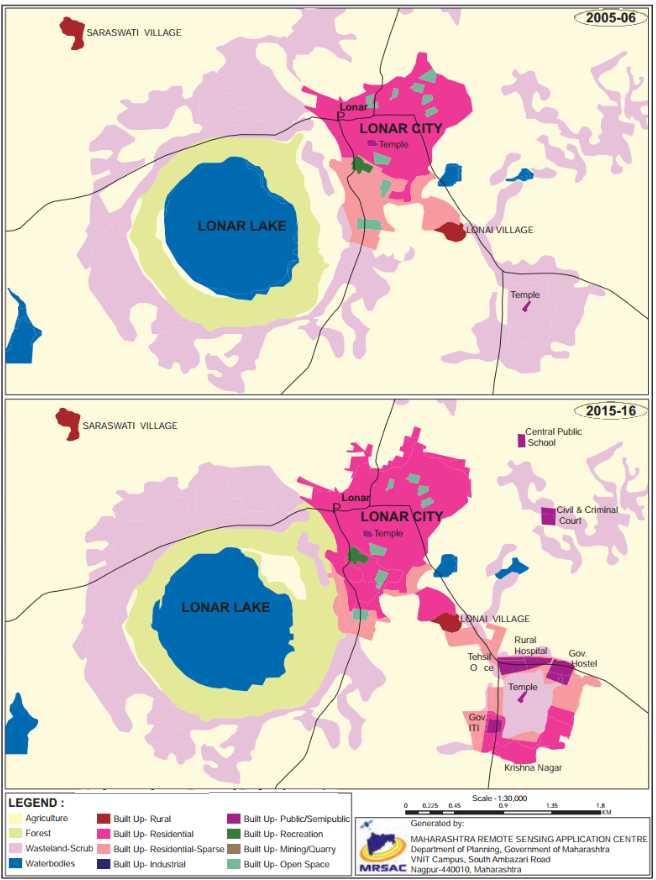
(i) Which periods do the map belongs to?
(ii) Which land covers have reduced? What are their colours?
(iii)Which landcovers seen to have increased? what are their colours?
(iv) Which land cover has been replaced by increased landcovers?
(vi) Write a conclusive note comparing both the maps.


Image
(1)Which means of transportation are shown in the map?
(2)Between which continents do you see an overall higher flow of transportation?
(3)Which canals can you see in their waterways? What can be the purpose?
(4)Which two major cities in India are connected internationally through airways?
(5)Which two continents show lesser use of air routes? Why?