Question
Study the given graphs (i) and (ii) and complete the corresponding tables below.
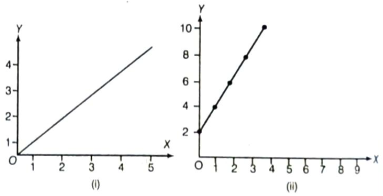
(i)
(ii)
(i)
| $x$ | 0 | 1 | 2 | 3 |
| $y$ |
| $x$ | 0 | 1 | 2 | 3 | 4 |
| $y$ |
| $x$ | 0 | 1 | 2 | 3 |
| $y$ |
| $x$ | 0 | 1 | 2 | 3 | 4 |
| $y$ |
| $x$ | 0 | 1 | 2 | 3 |
| $y$ | 0 | 1 | 2 | 3 |
| $x$ | 0 | 1 | 2 | 3 | 4 |
| $y$ | 2 | 4 | 6 | 8 | 10 |
Generate a complete, print-ready paper with questions like this in minutes — across 16+ boards, with answer keys.
| No. of litres of petrol | $10$ | $15$ | $20$ | $25$ |
| Cost of petrol in ₹ | $500$ | $750$ | $1000$ | $1250$ |
|
Items
|
Wheat
|
Rice
|
Tea
|
|
Production (in metric tons)
|
$3260$
|
$1840$
|
$900$
|