Question
Use a pair of compasses and construct the following angles:
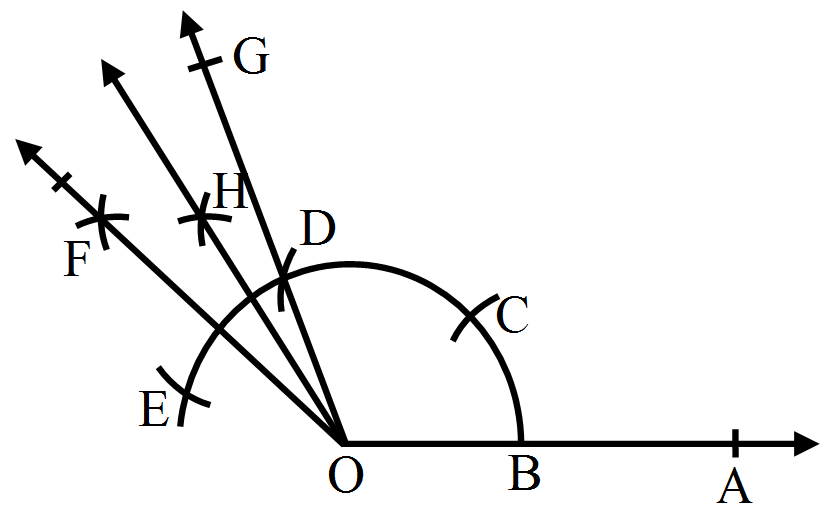
135°

Answer


Steps of Construction:
  1. Draw a ray OA.
  2. With O as centre and any suitable radius draw an arc above OA, cutting it at B.
  3. With B as centre and same radius as before draw another arc to cut the previous arc at C. With C as centre and same radius draw the arc to cut it at D. Again with D as centre and same radius cut the arc at E.
  4. Join OD and produce it to G. Then $\angle\text{AOG}=120^\circ.$
  5. With D as centre and radius more than half DE draw an arc.
  6. With E as centre and same radius draw another arc to cut the previous arc at F Join OF.
  7. Draw the bisector OH of $\angle\text{GOF}.$
Then, $\angle\text{AOH}=135^\circ$ is the required angle.

Need a full question paper?

Generate a complete, print-ready paper with questions like this in minutes — across 16+ boards, with answer keys.

Start Generating Free

Similar questions

Draw a line segment of length 10cm and bisect it. Further bisect one of the equal parts and measure its length.
At the Rice Research Centre at Tumsar there are 2610 kg of seeds of the basmati variety and 1980 kg of the indrayani variety. If the maximum possible weight of seeds has to be filled to make bags of equal weight what would be the weight of each bag? How many bags of each variety will there be?
Avinash works as a lecturer and earns Rs. 12000 per month. His wife who is a doctor earns Rs. 15000 per month. Find the following ratios:
  1. Avinash's income to their total income.
  2. Avinash's income to their total income.
Draw a line segment PQ = 6.2cm. Draw the perpendicular bisector of PQ.
Margarette works in a factory and earns Rs. 955 per month. She saves Rs. 185 per month from her earnings. Find the ratio of:
  1. Her savings to her income.
  2. Her income to her expenditure.
  3. Her savings to her expenditure.
Draw a line segment PQ of length 12cm. Mark a point O outside this segment. Draw a line through O perpendicular to PQ.
$3 \frac{1}{3}-1 \frac{1}{4}$
The names and numbers of animals in a certain zoo are given below. Use the data to make a bar graph. (Scale: On Y axis, 1 cm = 4 animals).
AnimalsDeerTigerMonkeyRabbitPeacock
Number20412168
Construct a frequency distribution table for the following marks obtained by 25 students in a history test in class VI of a school:
9, 17, 12, 20, 9, 18, 25, 17, 19, 9, 12, 9, 18, 17, 19, 20, 25, 9, 12, 17, 19, 19, 20, 9
  1. What is the range of marks?
  2. What is the highest mark?
  3. Which mark is occurring more frequently?
Match the following statements:
  Column A   Column B
i Line segment has a at a point
ii Two segments may intersect b if they have equal lengths
iii Two segments are congruent c two end-point
iv Line segment is d portion of a line